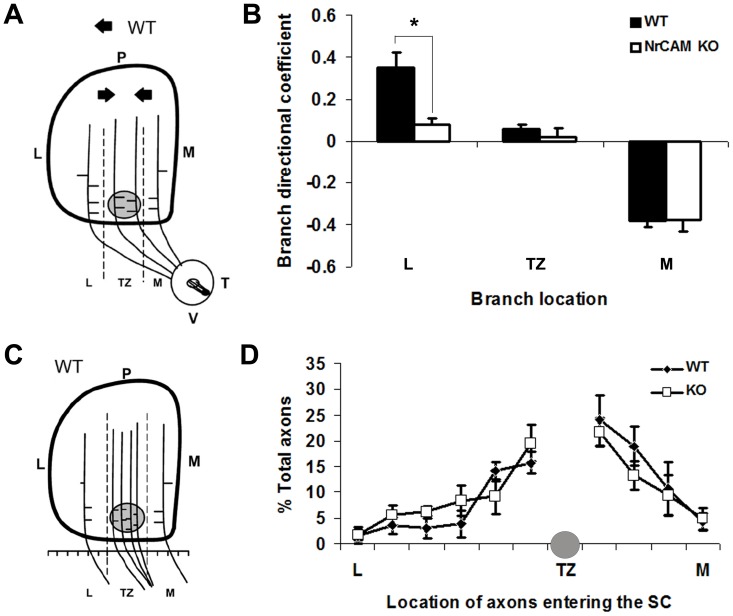
Figure 5. Branching and Entry Position of RGC Axons in the Superior Colliculus of WT and NrCAM Null Mice.
A. Diagram of the location and branch orientation of DiI-labeled axons from the VT retina within the SC of WT mice at P3. The SC was divided into 3 bins along the medial-lateral axis as shown by the dashed lines: lateral to TZ (L), within TZ (TZ), and medial to TZ (M). The shaded circle represents the site of the forming TZ. Branches were scored and their orientations were analyzed within each bin. The arrows represent the preferred orientation of WT branches. B. Branch distribution of VT RGC axons in WT and NrCAM null mutant (KO) mice. The distribution of branches was expressed as a branch directional coefficient for each bin by subtracting the number of laterally oriented branches from medially oriented branches, then dividing by the total number of branches. In WT (n = 4) and NrCAM null (n = 4) mice, 184 and 205 branches were analyzed, respectively. Brackets indicate S.E.M., and asterisks show significant differences (ANOVA, p<0.05). C. Diagram of entry position of VT RGC axons in the SC of WT mice at P3. The SC was divided into 10 equal segments along the medial-lateral axis at its anterior border relative to the position of the forming TZ: lateral to TZ (L), within TZ (TZ), and medial to TZ (M). The position of labeled RGC axons in each segment was scored and expressed as the percent of total axons. D. Distribution of DiI-labeled VT RGC axons of WT and NrCAM null mutant (KO) mice entering the anterior SC (expressed as the percent of total axons) in bins along the mediolateral axis, as described in C. Shaded circle indicates region near the location of normal TZ. In WT (n = 4) and NrCAM null (n = 4) mice, 146 and 167 axons were analyzed, respectively. Error bars represent SEM. There were no significant differences between WT and mutant at any location (ANOVA, p<0.05).

