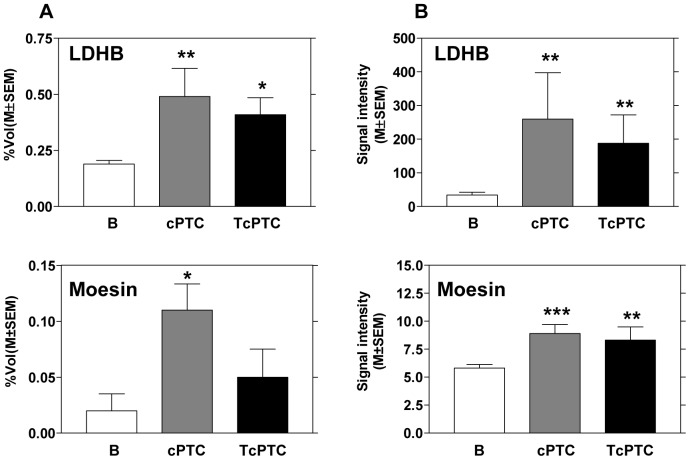
Figure 2. Expression of LDHB and Moesin in post-surgical and pre-surgical FNA.
(A) Histograms of the percentage volumes previously obtained in FNA of surgical specimens with 2DE for LDHB and Moesin; (B) The ELISA array detection results for LDHB and Moesin in pre-surgical FNA. Each bar represents the mean ± SEM of percentage volume and signal intensity. Analysis B vs cPTC, B vs TcPTC (*p<0.05, **p<0.01, ***p<0.001).

