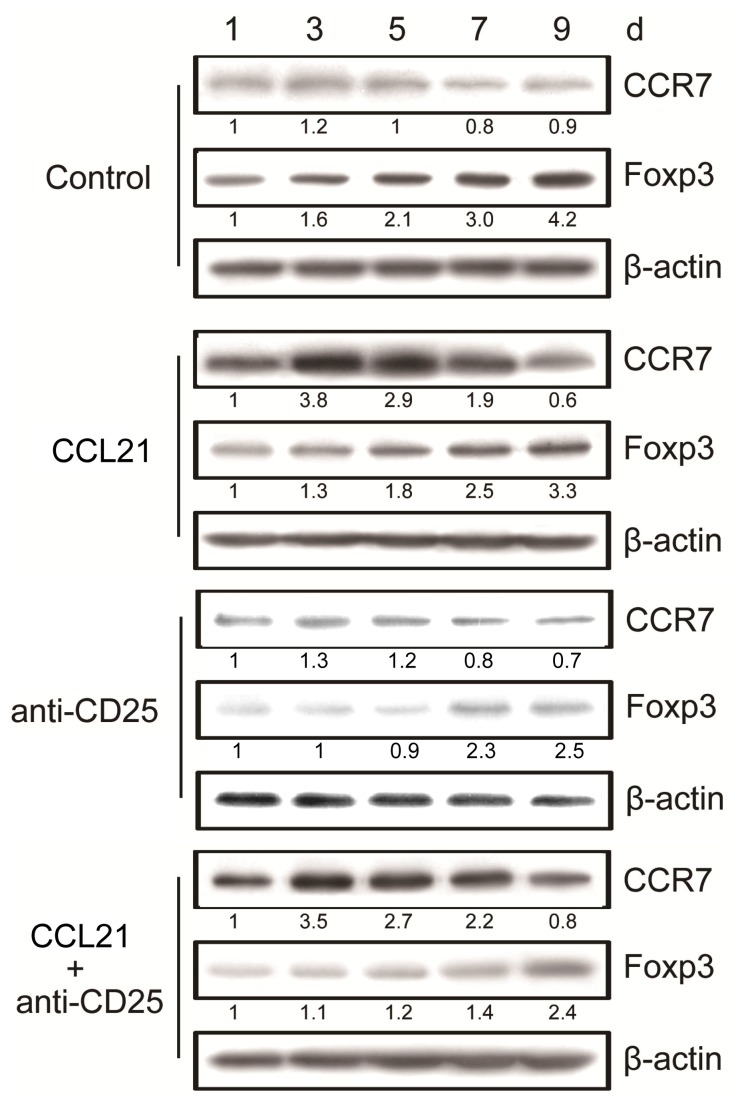
Figure 4. Dynamic changes of CCR7 and Foxp3 expression after combination treatment.
CCR7 and Foxp3 expressions in tumor tissue lysates on day 1 to 9 after treatment initiation were determined by western blot. β-actin was used as a an internal control. Protein levels were determined by densitometry analysis and were expressed as ratios to β-actin (below each blot). The ratio obtained from the first lane was set as 1. All data were representative of at least two independent experiments.

