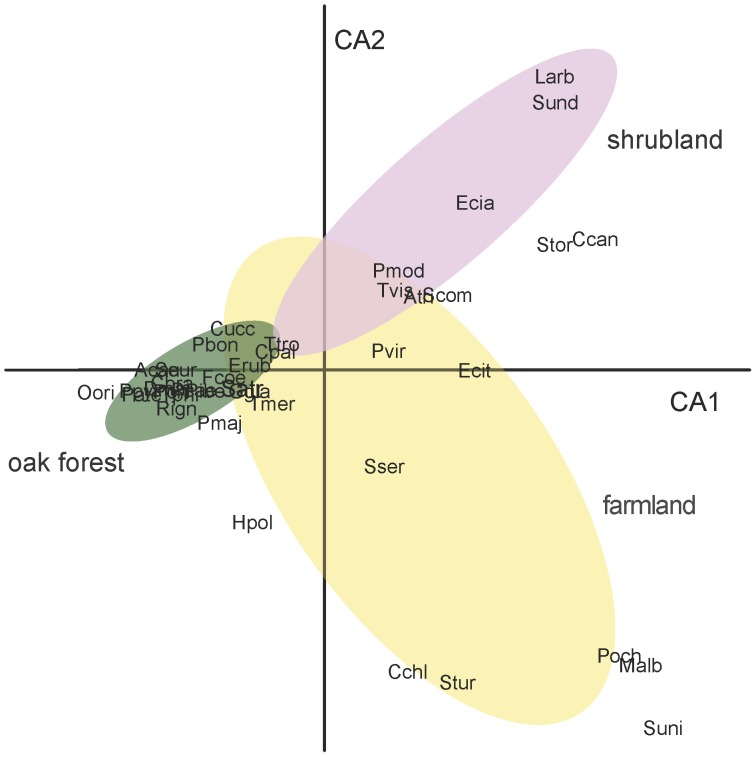
Figure 2. Plot of first two axes of the correspondence analysis of bird relative abundance versus point-count.
The ellipses enclose the points of the same land-use (confidence region of 95%): farmland (yellow), shrubland (rose) and oak forest (green). Bird species are represented by their species code (see Table S1).

