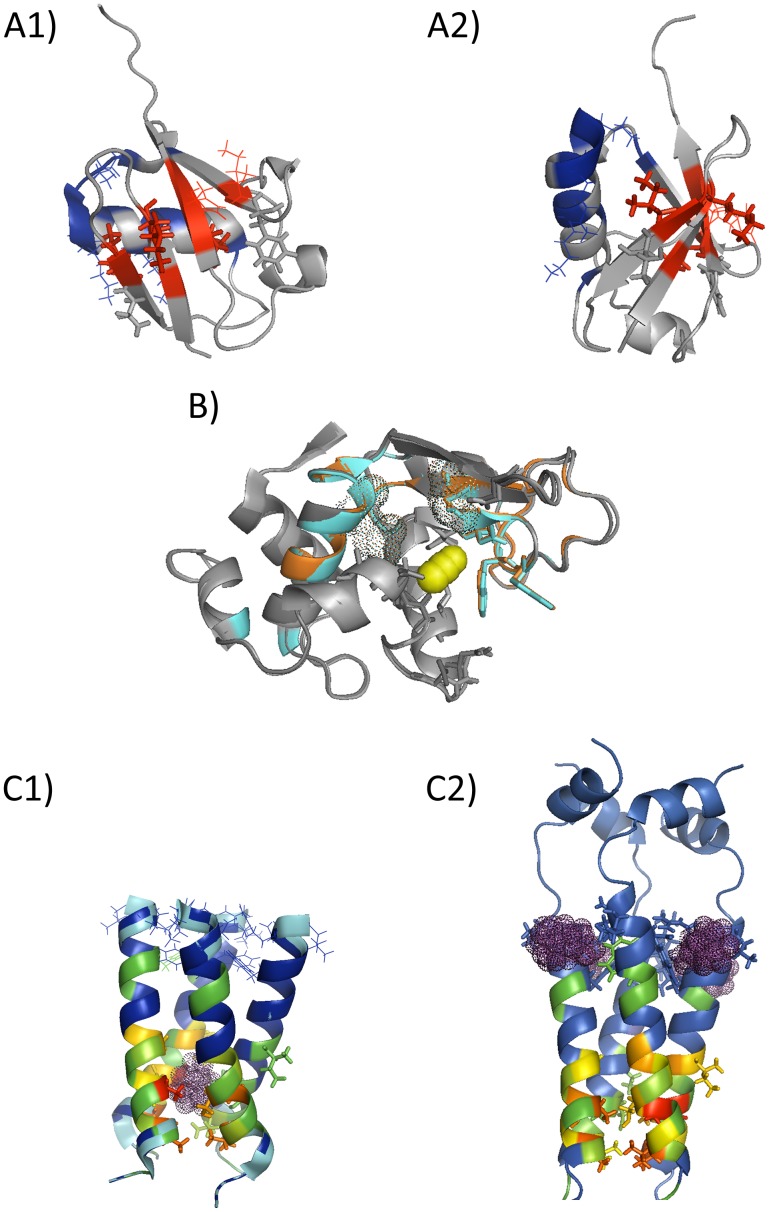
Figure 1. (A1 & A2) The GNM analysis performed on Ubiquitin (1 D3Z [104]).
Experimentally determined hot spot residues (lines) and the long range interactions (sticks) are shown with the exact outcome of the fastest mode (blue) and the second fastest mode (red). Details are in Figure S10. (A1) and (A2) display the same figure from two perspectives. (B) The residues fluctuating in the high frequency modes by GNM for the unbound (dark grey: 2LYM [89]) and bound (light grey: 2LYO [83]) hen egg-white lysozyme (HEWL) structures in orange and in cyan, respectively. Experimentally determined hot spot residues (sticks), ligand (yellow sphere), and catalytic residues (dots) are also shown. See Figure S11. (C1 &C2) The GNM analysis performed on Influenza virus M2 proton channel, 3BKD [95]: (C1) the amantadine bound structure 2KQT [105] and (C2) the rimantadine bound 2RLF [91]. The exact outcome of the fluctuations in the average five fastest modes above the threshold is colored based on the strength of fluctuations in the decreasing order (red to green). Blue display the residues below the threshold. Rimantadine and amantadine are shown in magenta dots with the corresponding sites in lines and in sticks, respectively. See Figure S12.

