
Figure 2.
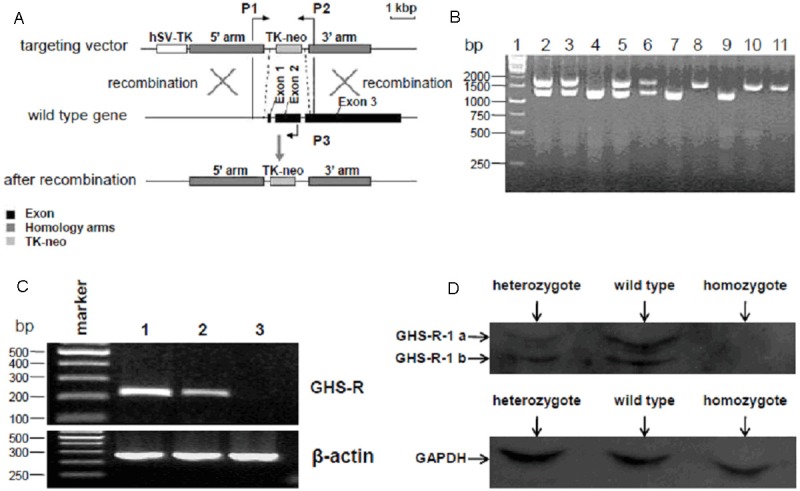
Identification of GHS-R-/- mice. A: Strategy for the PCR identification of GHS-R gene knockout mice. PCR primers (P1, P2 and P3) were designed targeted to the relative sites as shown in the schematic diagram. B: PCR identification of GHS-R gene knockout mice. Genomic DNAs extracted from tails of the hybridized mice were analyzed by PCR identification as described in Materials and Methods. The 1.2 kbp of PCR products observed in lane 4, 7 and 9 represented the GHS-R+/+, and 1.9 kbp of PCR products observed in lane 8, 10 and 11 represented the GHS-R-/-, while both the 1.2 kbp and 1.9 kbp of PCR products observed in lane 2, 3, 5 and 6 represented the GHS-R+/-. C: RT-PCR identification of GHS-R gene knockout mice. Total RNA extracted from the hypothalamus of the hybridized mice was used for RT-PCR identification with specific primers targeting to GHS-R gene and β-actin. The levels of β-actin mRNA represented by 260 bp of PCR products were nearly equal in all the three lanes. The GHS-R mRNA expression represented by 217 bp of PCR products was observed in wild-type and heterozygote, while not detected in homozygote (lane 3). Moreover, the levels of GHS-R mRNA in heterozygote (lane 2) were lower compared with those in wild-type (lane 1). D: Analysis of GHS-R expression in hybridized mice by western blot. Total protein extracted from the hypothalamus of the hybridized mice was quantified and analyzed by western blot using specific GHS-R and GAPDH antibodies. GAPDH expression was detected with the nearly same quantity in all three lanes. GHS-R expression detected in wild-type and heterozygote were presenting in two bands, GHS-R-1a (upper) and GHS-R-1b (lower). Moreover, the levels of GHS-R expression in heterozygote were lower compared with those in wild-type. However, GHS-R expression in homozygote was under detectable.