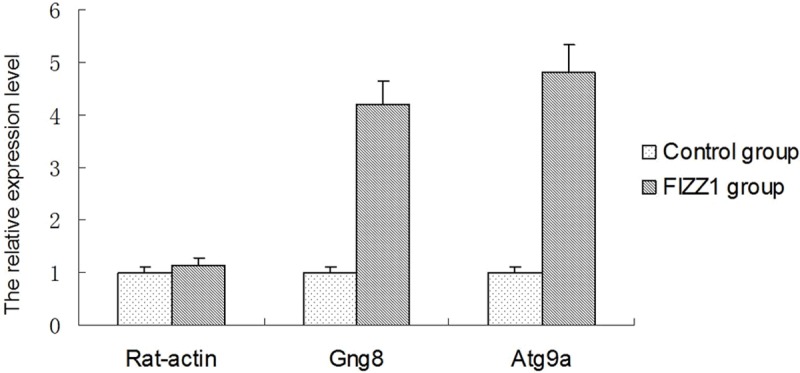
Figure 3.

mRNA expressions of Rat-actin, Gng8 and Atg9a in two groups. Total RNA was extracted from RAECs and RAECs with FIZZ1 at the end of 12 h after drug administration. Results are expressed as fold relative to mRNA levels in RAECs after FIZZ1 treated with control group.*P < 0.05, compared to respective control.
