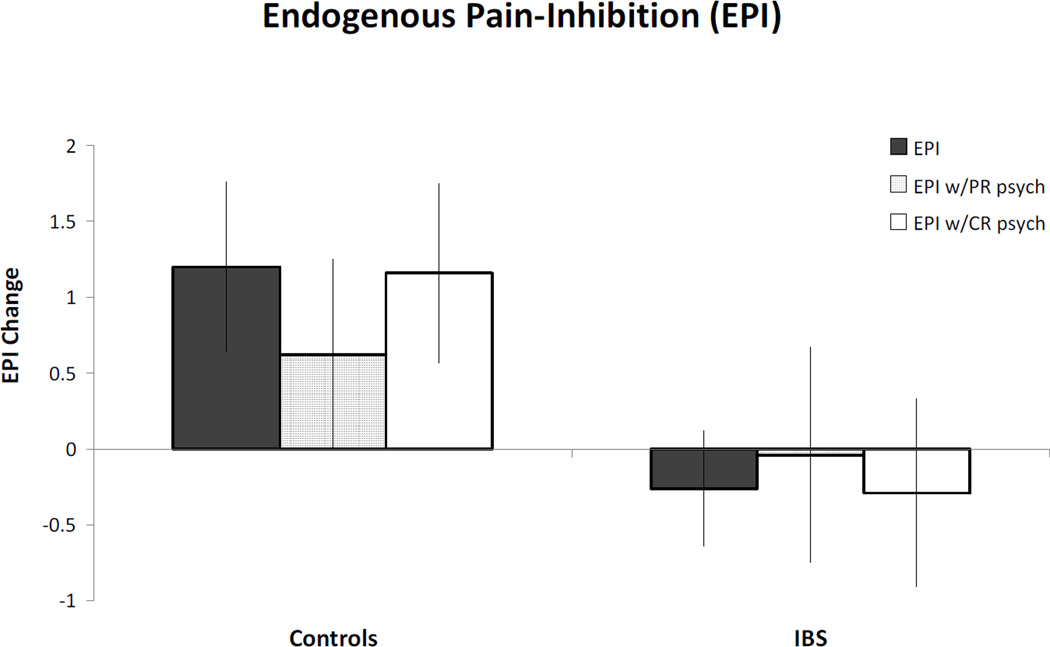
Figure 1. Endogenous Pain-Inhibition.
Positive number represents pain inhibition and negative number represents pain facilitation. IBS is irritable bowel syndrome. Solid grey bars represent endogenous pain-inhibition effect for each group without any covariates. Middle (lined) bars represent endogenous pain-inhibition effect with significant parent-report (PR) psychological variables (child anxiety, child depression, and child somatization) included as covariates. White bars represent endogenous pain-inhibition effect with significant child-report (CR) psychological variables (anxiety & somatization) included as covariates. * indicates significance at p<.05. Although results are no longer significant after covariates are included, a similar pattern of results is present.

