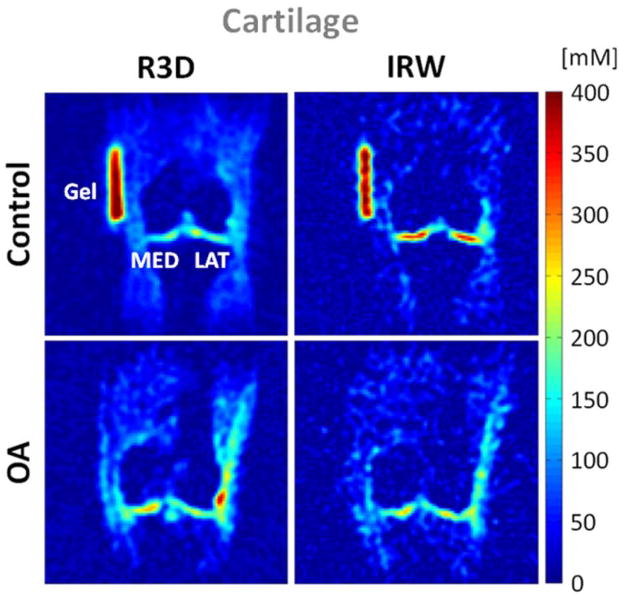
Figure 10.
Example of cartilage sodium concentration maps from a healthy volunteer (control) and a patient with osteoarthritis (OA). Images were acquired with 3D radial (R3D) and IR WURST (IRW). IR WURST was used to suppress fluids through inversion recovery (IR) with an adiabatic WURST pulse in order to increase the sensitivity of the method to change of sodium concentration within the cartilage only. MED = femoro-tibial medial and LAT = femoro-tibial lateral cartilage.

