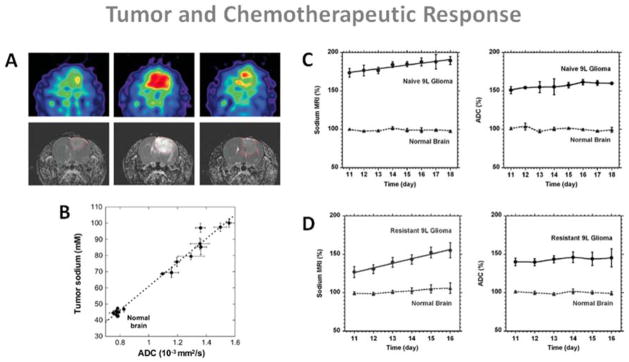
Figure 13.

Examples of sodium MRI and proton DWI studies on tumor and chemotherapeutic response in a rat glioma. A: Sodium images (top) and proton ADC maps (bottom) of a BCNU-treated 9L rat glioma acquired at day 0, 7 and 23 (left to right) after BCNU injection, performed at day 17 after tumor implantation. Central sodium image at day 7 show a dramatic increase of sodium concentration throughout the entire tumor area. Image at day 23 shows tumor regrowth after tumor shrinking started at day 9 and its maximum regression at day 16. B: Correlation of tumor sodium concentration and ADC in the rat glioma obtained at various points following a single dose of BCNU. C: Time course after tumor implantation of sodium (left) and ADC (right) variations for a naive type 9L glioma. Sodium and ADC data are given in percent relative to normal contralateral brain. All data are presented as mean ± standard deviation. Sodium concentration steadily increased in the naive tumor with a rate of 2.4% per day while ADC was practically unchanged (1.4% per day). D: Time course after tumor implantation of sodium (left) and ADC (right) variations for a glioma created from a resistant 9L cell line. Sodium concentration steadily increased in the resistant tumor with a rate of 5.8 % per day while ADC was practically unchanged (1.2% per day). Sodium values were corrected for partial volume effect. Figures A and B from Schepkin V.D et al. Magn Reson Med 53:85–92, 2005. Figures C and D from Schepkin V.D. et al. Magn Reson Med 67:1159–1166, 2012. Reproduced by permission of Wiley-Blackwell.
