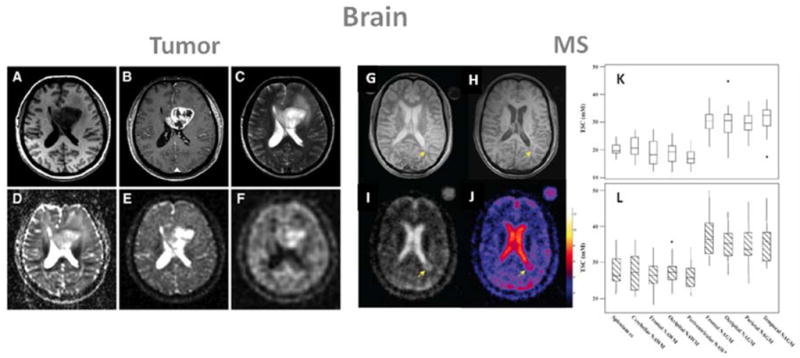
Figure 7.

Examples of brain images: A–F form a patient with glioblastoma (WHO grade IV) of the left medial frontal lobe., and G–L: images and tissue sodium concentrations (TSC) from a patient with multiple sclerosis (MS). A: T1 weighted MRI, B: T1 weighted MRI with contrast medium (rim enhancement), C: T2 weighted MRI showing cystic and solid portions of the lesion and perifocal brain edema, D: DWI showing elevated ADC values in the center of the tumor, E: sodium MRI showing increased sodium signal in the tumor, F: sodium MRI with fluid suppression by inversion recovery (IR), also showing increased sodium signal mainly at the center of the tumor. Proton images (A–D) were acquired at 3T while sodium images (E, F) were acquired at 7T. G: proton density MRI, H: T1 weighted MRI, I: sodium MRI, J: corresponding TSC map. K: box-plot of the mean TSC value distribution in regions of white matter and grey matter in healthy controls. L: box-plot of the mean TSC value distribution in regions of the corresponding normal appearing white matter (NAWM) and normal appearing grey matter (NAGM) in patients with relapsing-remitting MS. cc is corpus callosum. Figures A–F from Nagel A. et al. Investigative Radiology 46(9), 539–547, 2011. Reproduced by permission of Wolters Kluwer Health. Figures G–L from Inglese M. et al. Brain 133, 847–857, 2010. Reproduced by permission of Oxford University Press.
