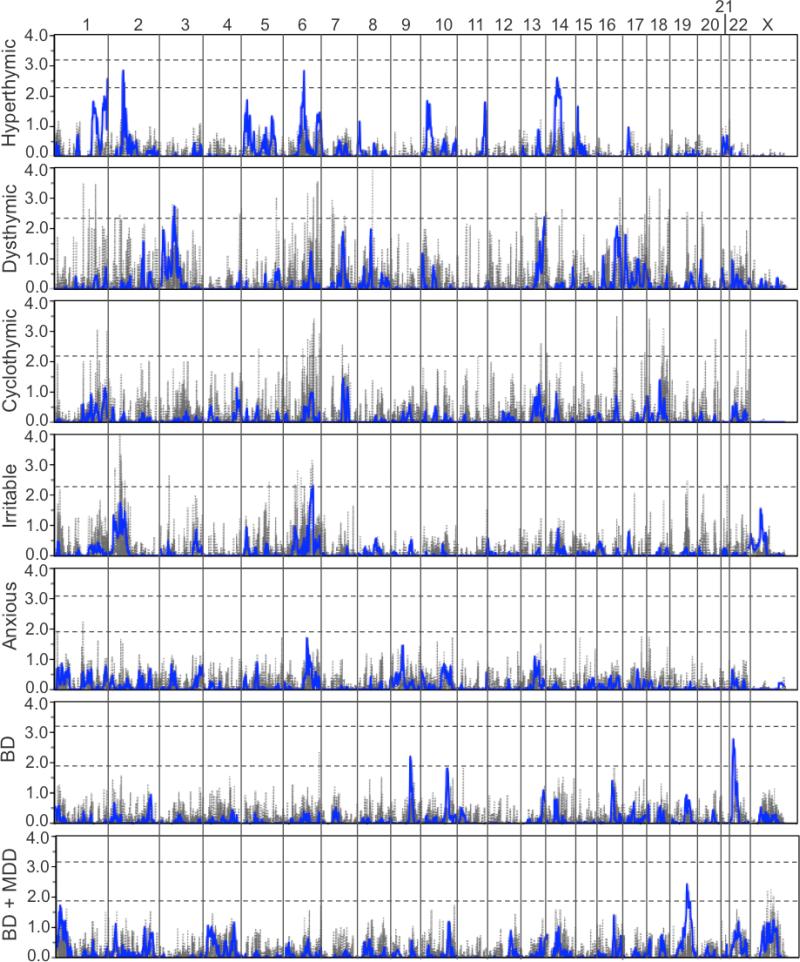
Figure 2.
Results of the genome-wide SNP linkage scan in the 51 families for each of the five temperaments. The results from the analysis of BD diagnosis as a narrow (BD) and broad (BD + MDD) phenotype in these families are provided for comparison. Multipoint results are shown in blue with two-point results shown in gray. LOD scores are indicated on the y-axis, along with the name of the corresponding temperament or diagnostic category, and chromosomes are aligned along the x-axis end to end with the p-terminus on the left and locations indicated at the top of the figure. Dashed horizontal lines indicate significant and suggestive LOD score thresholds for each phenotype based on simulation. Note that LOD score significance thresholds for dysthymic, cyclothymic, and irritable were >4.0 and are not shown.

