
Figure 5.
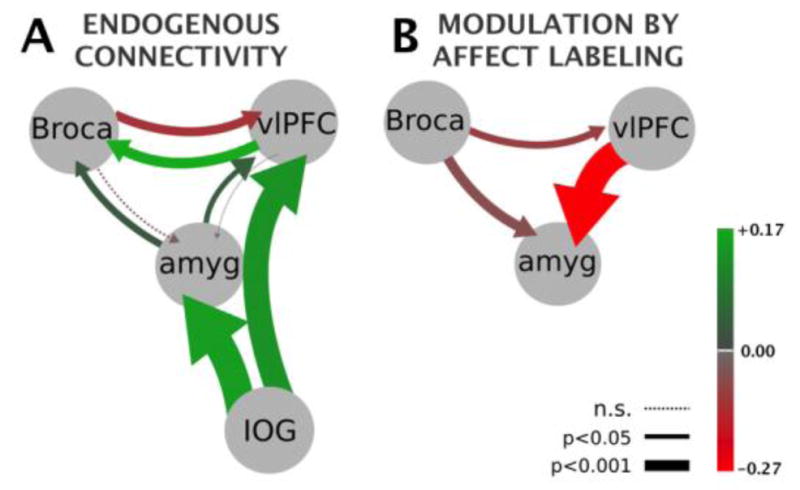
Graphic depiction of Bayesian Model Averaging results (Table 2). Color saturation values map to mean effective connectivity parameters (in hertz) while arrow thickness maps to statistical significance proportional to log(1/p-value). (A) Endogneous connectivity. (B) Modulation of connectivity by affect labeling representing the three tested connections. Due to the basic bilinear DCM equation the modulation values add to the endogenous values. Driving input (not shown graphically) enters the IOG in both states.