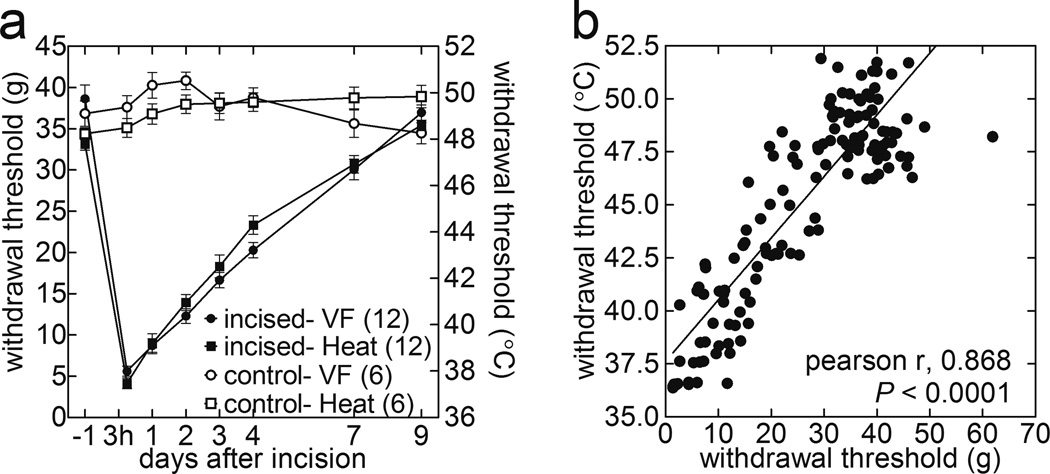
Figure 6.
PWT-H measure is comparable with PWT-M in detection of incision-induced hyperalgesia, and its recovery over time. Baseline PWT data used in Figure 5a. (a) Time courses of the mean PWT-H and PWT-M evaluated at baseline, 3-h, 1, 2, 3, 4, 7, and 9-d post-incision. PWT-H: sham vs. incision, F1,16 =72.0, P<0.0001 at 3-h, 1, 2, 3, 4, and 7-d; PWT-M: sham vs. incision, F1,16 =73.5, P<0.0001 at 3-h, 1, 2, 3, 4, and 7-d (2-way ANOVA followed by Bonferroni’s post-hoc tests). (b) Correlation between PWT-M and PWT-H throughout post-incision recovery period. The degree of hyperalgesia increases from left to right along the regression line. (Pearson r = 0.87; P<0.0001).

