
Figure 1.
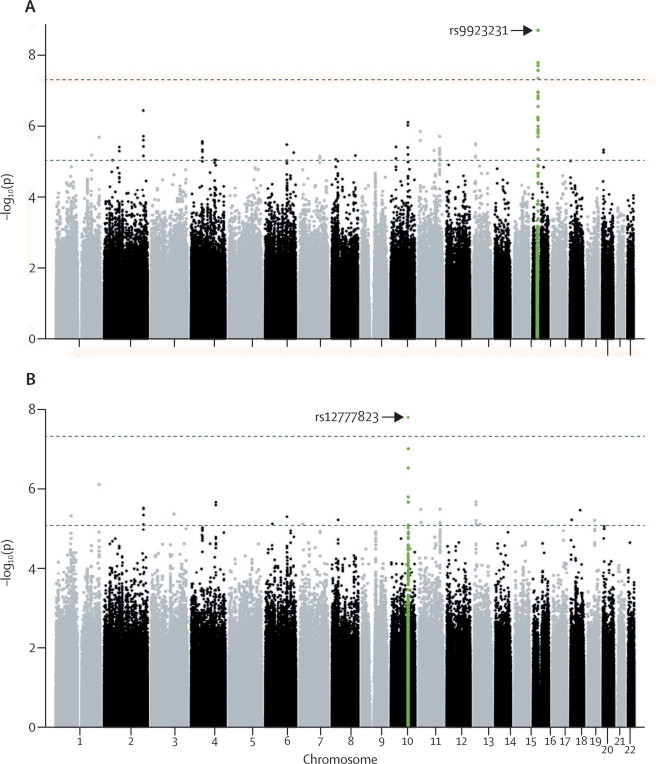
Manhattan plots showing associations between single nucleotide polymorphisms and stable warfarin dose in the discovery cohort
(A) Without and (B) with prespecified conditioning. The top line shows p=5×10⁻⁸. Green points indicate genome-wide significant regions.