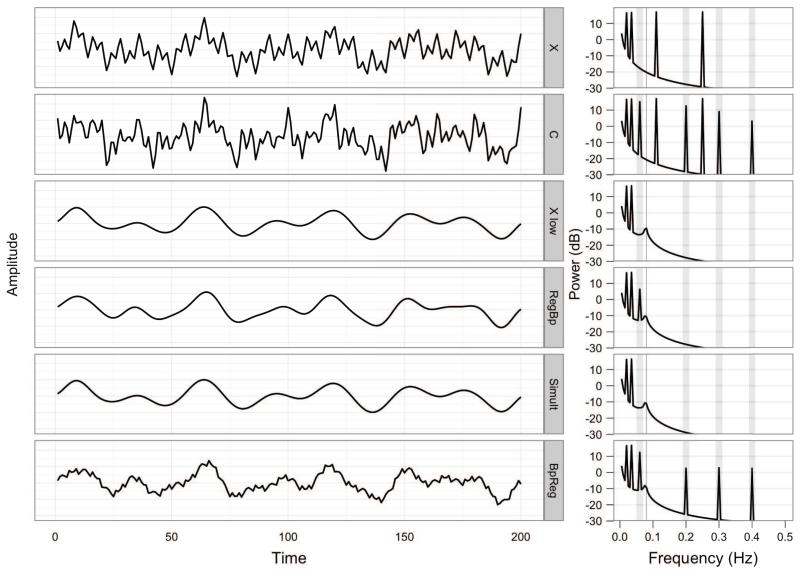
Figure 1.
The effects of bandpass filtering and nuisance regression on the spectral composition of simulated time series. The left panel depicts the simulated time series, X and C, over time, as well as X following different approaches to bandpass regression and nuisance regression. The right panel depicts the spectral power of the series, and vertical gray rectangles denote the nuisance frequencies present in C that one wishes to suppress. Xlow contains the low frequency components of X after bandpass filtering, .009 Hz < f < .08 Hz. RegBp = nuisance regression, then bandpass filtering; Simult = simultaneous bandpass filtering and nuisance regression; BpReg = bandpass filtering, then nuisance regression.

