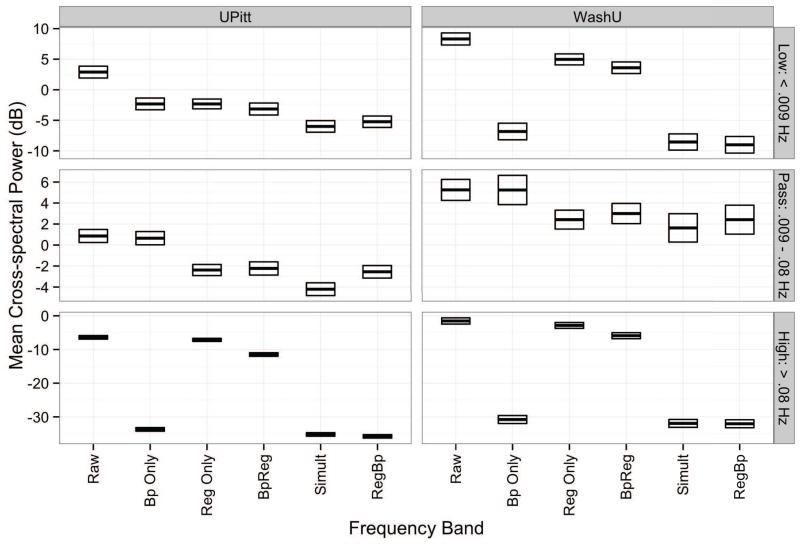
Figure 4.
Mean cross-spectral power of RS-fcMRI time series with the 18 nuisance regressors. Estimates reflect average cross-spectral power across the 18 regressors in the low-frequency stopband (f < .009 Hz), passband (.009 – .08 Hz), and high-frequency stopband (f < .08 Hz) ranges. Darkened lines denote the mean power estimate, and the bounds of the boxes indicate one standard error above the below the mean. Raw = fMRI time series prior to bandpass filtering and nuisance regression; Bp Only = Bandpass filtering without nuisance regression; Reg Only = Regression alone without bandpass filtering; BpReg = bandpass filteirng of fMRI data, then nuisance regression; Simult = simultaneous bandpass filtering and nuisance regression; RegBp = nuisance regression, then bandpass filtering.

