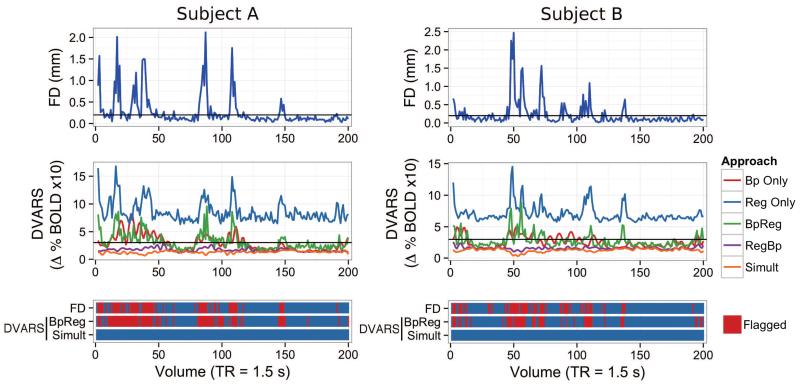
Figure 5.
Temporal correspondence of head movement (FD) and global BOLD signal fluctuation (DVARS) for two prototypical subjects from the UPitt cohort, using different preprocessing approaches. Framewise displacement (top panel, FD) summarizes the magnitude of rotational and translational head movement between volumes. The framewise change in the global BOLD signal for all brain voxels (middle panel, DVARS) was computed as the average root mean square variance across voxels of the temporal derivative of the fMRI time series (Power et al., 2012a). DVARS was computed separately for five preprocessing appraoches: 1) bandpass filtering alone (Bp Only); 2) nuisance regression alone (Reg Only); 3) bandpass filtering of fMRI data followed by nuisance regression of unfiltered signals, including motion parameters (BpReg); 4) nuisance regression of unfiltered signals followed by bandpass filtering of fMRI data (RegBp); and 5) simultaneous filtering of nuisance frequencies and nuisance regressors using a multiple regression framework (Simult). The bottom panel shows the correspondence of head movement (FD) and residual fluctuations in the BOLD signal (DVARS) for the BpReg and Simult approaches. Volumes exceeding FD > 0.2mm or DVARS > 3 are marked in red as potentially contaminated by motion, per the suggestion of Power and colleagues (Power et al., 2012b).

