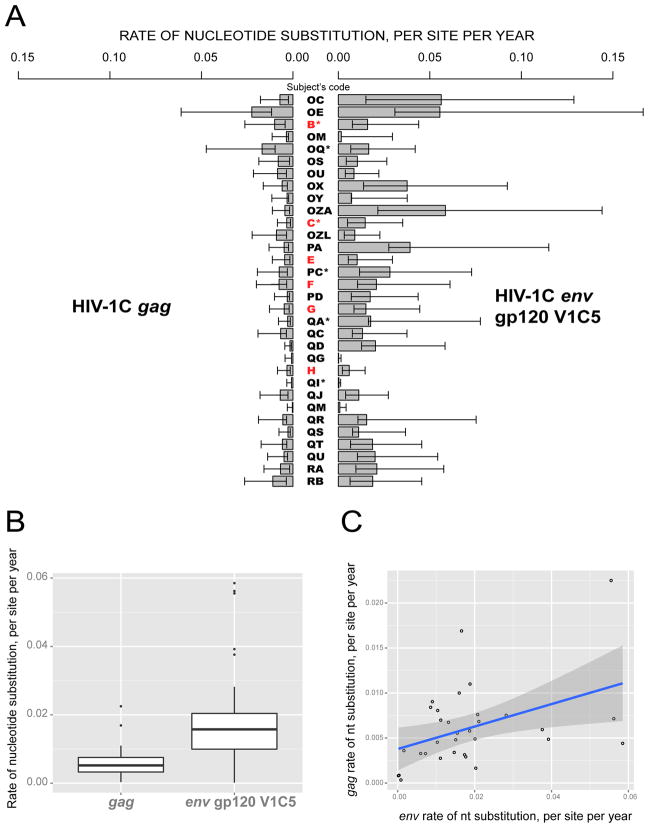
Figure 1.
Nucleotide substitution rates within HIV-1C gag and env gp120 V1C5 among 32 study subjects infected with a single viral variant. A: Individual intra-host rates of nucleotide substitution, shown as substitutions per site per year with lower HPD within bars and upper HPD outside bars. Subjects identified within acute HIV-1C infection are highlighted in red. Asterisks highlight subjects who initiated ART during the follow-up period. B: Summary of nucleotide substitution rates within HIV-1C gag and env gp120 V1C5. The boxplots highlight the median and the 1st and the 3rd quartiles of nucleotide distribution rates in gag and env gp120 V1C5. Whiskers correspond to the “1.5 rule”: less than Q1 – 1.5*IQR and greater than Q3 + 1.5*IQR. Open circles indicate outliers. C: Analysis using linear regression model to assess potential association between substitution rates in env gp120 V1C5 and gag.

