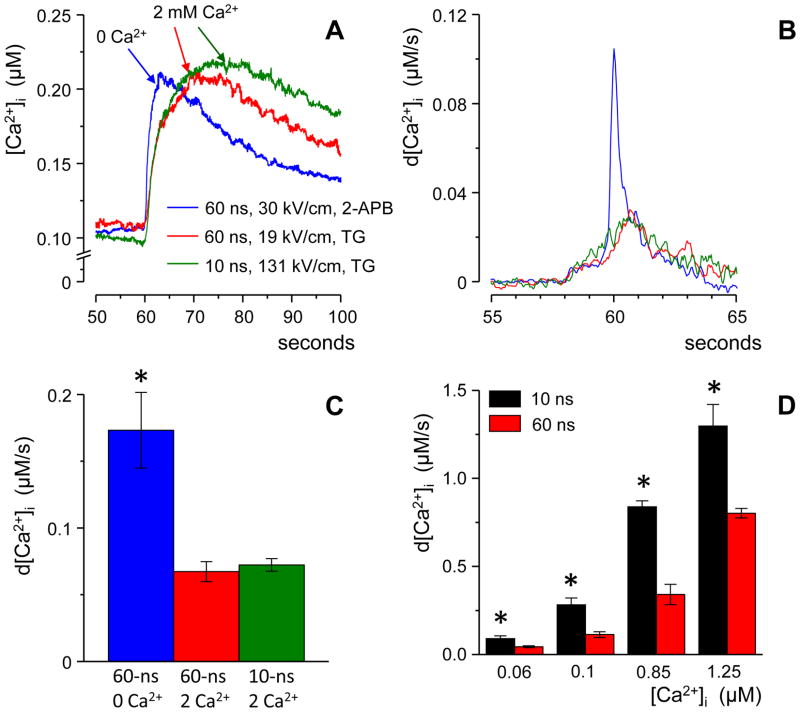
Fig. 5.
Ca2+ discharge from the endoplasmic reticulum (ER) is manifested by a faster rise of the nsEP-induced Ca2+ transient. (A) Traces of Ca2+ transients produced solely by the uptake of the extracellular Ca2+ (red and green) or solely by its discharge from the ER (blue). Each trace is an average for at least 15 cells.. Stimuli were applied at 60 s; the intensities were adjusted to evoke similar responses. (B) Traces from the panel (A) were differentiated in order to emphasize the rate of Ca2+ increase. For clarity, the traces were filtered, and the premature onset of the response is a filtering artifact; see text for details. (C) Peak rates of Ca2+ increase as measured from individual traces without filtering; same data as in (A) and (B). (D) Peak rates of Ca2+ increase for Ca2+ transients evoked by 10- and 60-ns stimuli in the presence of 2 mM external Ca2+ (the data from Fig. 2). Measurements were done without averaging or filtering.. Mean +/− s.e, n≥ 15; * p≤ 0.01.

