
Figure 1.
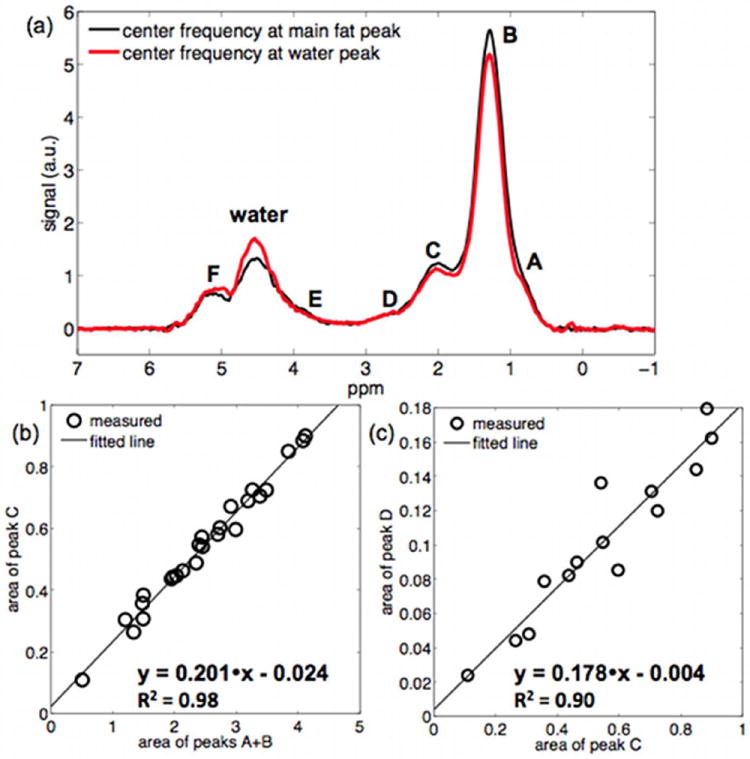
Model of bone marrow triglyceride structure: (a) typical proximal femur MR spectrum (acquisitions with center frequency at the main fat peak and at the water peak), (b) relationship between area of peak C and area of peaks A+B (for all acquired spectra with center frequency at the main fat peak), and (c) relationship between area of peak D and area of peak C (for spectra with center frequency at the main fat peak and with fat peak linewidth smaller than 0.4 ppm).