
Figure 2.
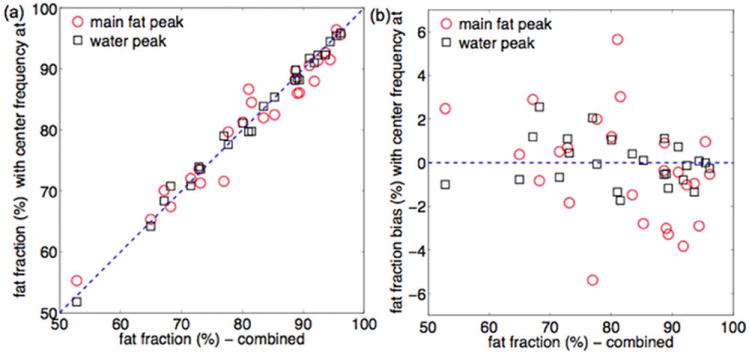
Chemical shift displacement effect on MRS-based fat fraction: (a) relationship between fat fraction based on combined spectra and fat fraction based on acquisitions with center frequency on the main fat peak and on the water peak (the dashed line represents the unity), and (b) corresponding fat fraction bias (the dashed line represents zero bias).