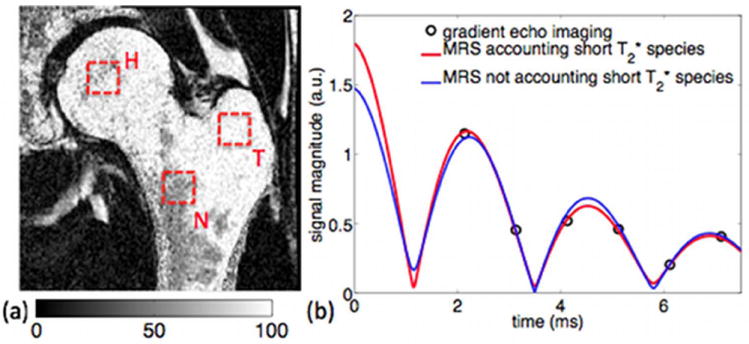
Figure 4.

(a) Imaging-based fat fraction map and typical MRS voxel locations in neck (N), greater trochanter (T) and head regions (H), and (b) time evolution of magnitude signal: experimental gradient echo imaging signal, fitted T2-corrected MRS time domain signal accounting for short T2* water species, and fitted T2-corrected MRS time domain signal not accounting for short T2* water species.
