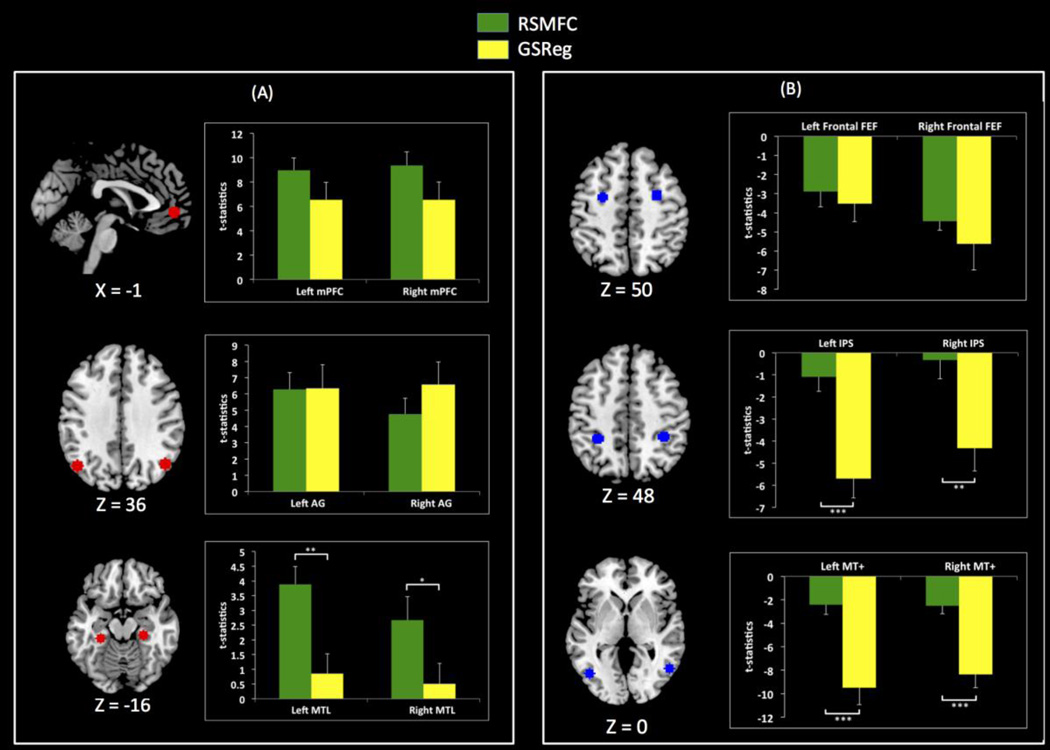
Figure 12. Comparison of PCC connectivity with target ROIs.
(a) Average t-statistics for PCC connectivity with DMN ROIs. For most DMN ROIs, GSReg and RSMFC yield comparable connectivity strength. However, compared to GSReg, RSMFC reveals that PCC is more tightly connected to bilateral left and right MTL. (b) Average t-statistics for ROIs that are negatively correlated with PCC. Anti-correlations are significantly weaker in RSMFC, compared to GSReg (*** p < 0.001, ** p < 0.01, * p < 0.05). PCC = posterior cingulate cortex. mPFC = medial prefrontal cortex. AG = angular gyrus. MTL = medial temporal lobe. FEF = frontal eye field. IPS = intraparietal sulcus. MT+ = middle temporal complex. RSMFC = random subspace method functional connectivity. GSReg = global signal regression method. DMN = default mode network.

