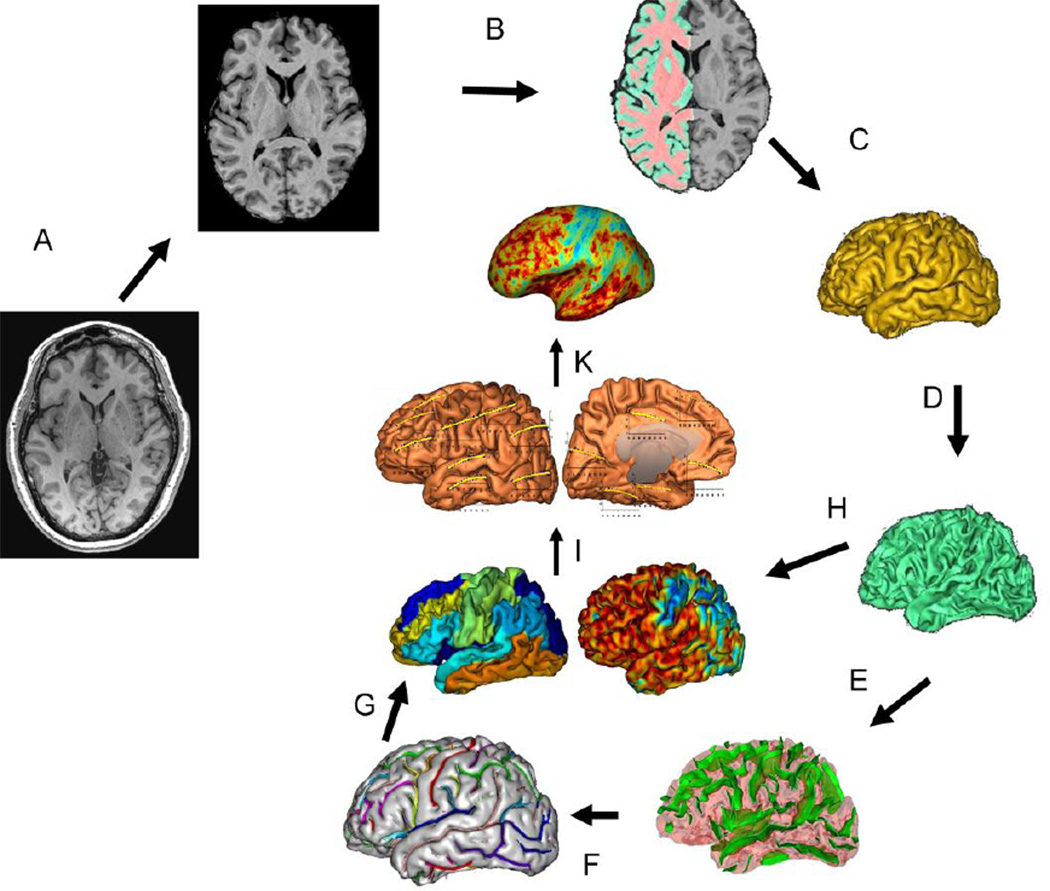
Figure 1.
T1-w image processing pipelines. A T1-w image is skull-stripped, globally spatially normalized, and RF-inhomogeneity corrected (A). Next, cerebral hemispheres and cerebellum and identified and tissue classified (B); cortical surfaces for GM and WM are calculated (C;D) and homotopic erosion operation and crevasse detector are used to reconstruct sulcal surface as the medial surface of the two opposing gyral banks (E). Sulcal identification pipeline uses a congregation of 500 artificial neural network-based pattern classifiers to identify (F) sulcal landmarks and to perform gyral segmentation of the cortex (G). GM thickness (GTM) was calculate as the distance between the pial (C) and GM/WM interface surfaces (H). Analyses are performed by measuring GMT for fourteen cortical areas (I) and vertex-wise (K).

