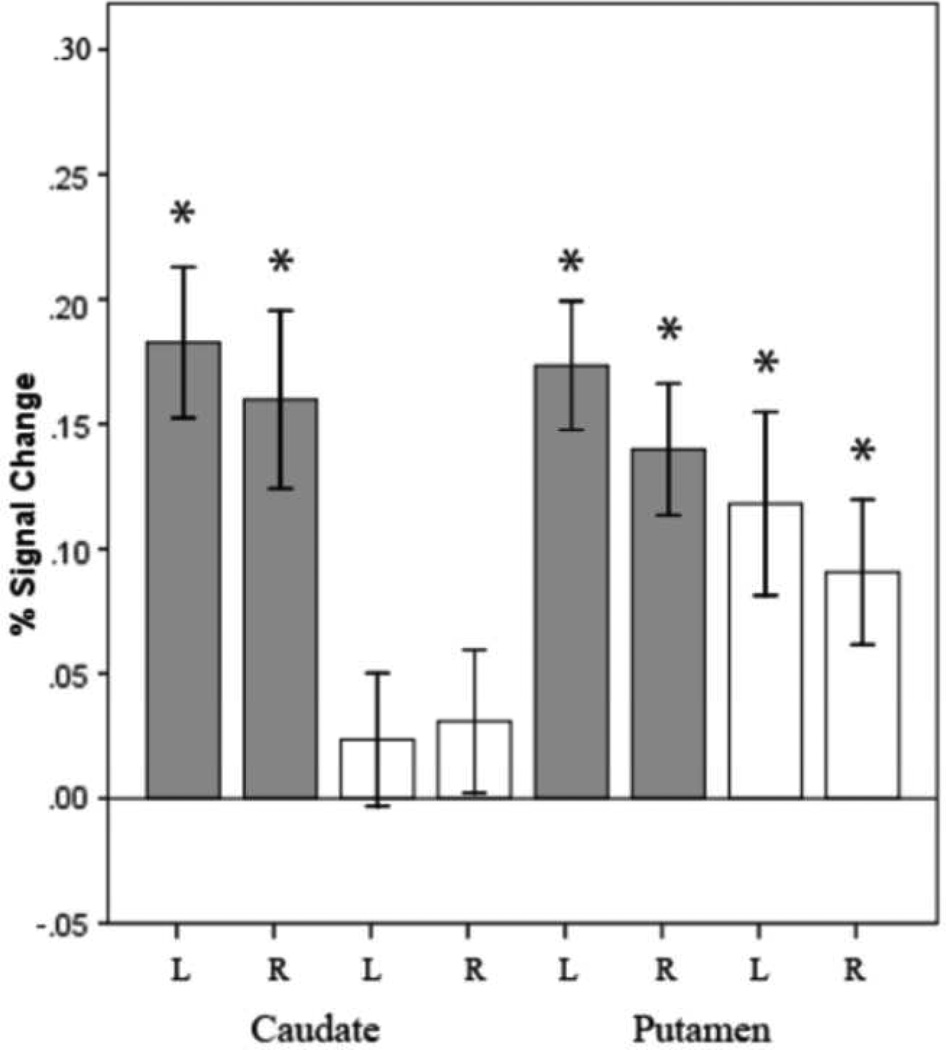
Figure 3.
Brain activity expressed as a percentage of signal change for sentence generation (grey) and sentence repetition (white) for the anatomical ROIs of the left and right caudate and putamen. The asterisk indicates that the statistics are significant (p ≤ .005). Error bars represent +/−1 Standard Error of the Mean.

