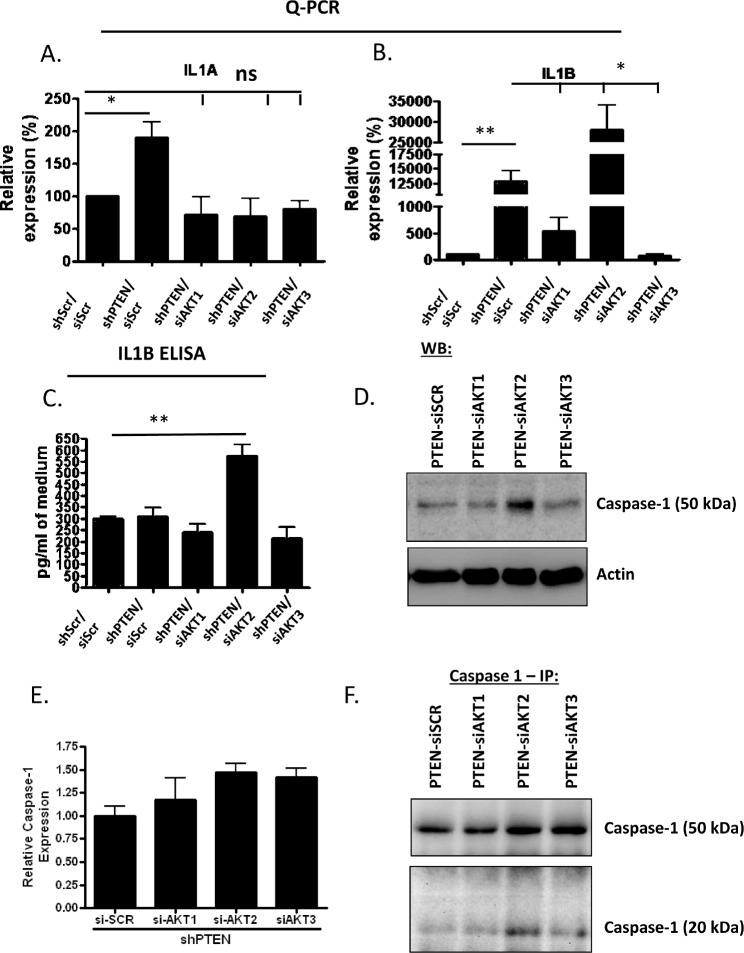
Figure 6. IL1B expression, cleavage and release in PTEN/AKT2 depleted fibroblasts.
A) IL1A levels were determined in fibroblasts depleted for PTEN and each single AKT isoform using real-time PCR. B) As in (A) but IL1B levels are shown. C) ELISA analysis for IL1B in media from organotypic cultures where the fibroblast cells were depleted of PTEN and individual AKT isoforms. Media was concentrated 14 times before ELISA was performed. Figure is average of two separate experiments. D) Western blot showing increase in caspase 1 in PTEN/AKT2 depleted fibroblasts. E) mRNA levels of IL1B show that expression of Caspase 1 is not significantly different in fibroblasts depleted of PTEN and each of the individual AKT isoforms. F) Shows the increase in the cleaved form of caspase 1 in PTEN/AKT2 depleted fibroblasts.

