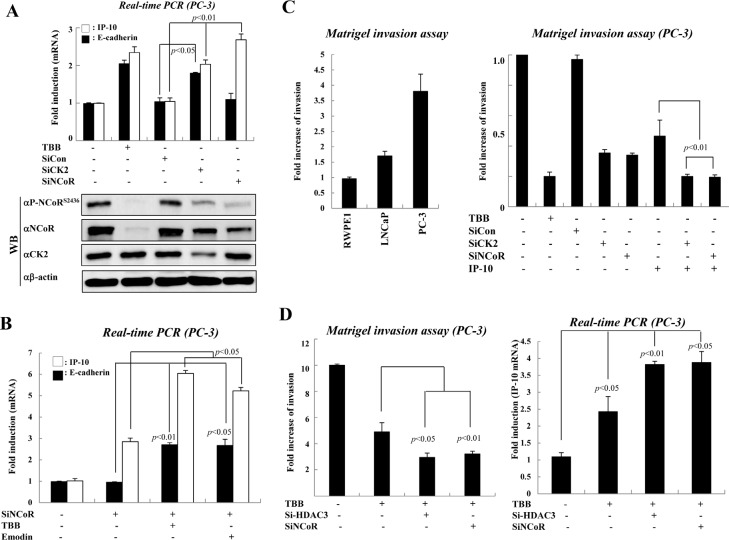
Figure 2. The activated CK2-NCoR network promotes invasion activity of PC-3 cells.
(A) PC-3 cells were treated with TBB (50 μM, 6 hr) or the indicated siRNAs and cDNA was prepared for real-time PCR. Error bars indicate SD (n=3). Cell lysates were analyzed by Western blotting. (B) PC-3 cells were treated with CK2 inhibitors (TBB, emodin) or transfected with siNCoR. cDNA was prepared for real-time PCR analysis. Error bars indicate SD (n=3). (C) Invasive growth of prostate cancer cells was analyzed by counting cells that migrated through the extracellular matrix layer of Biocoat Matrigel invasion chambers. Error bars indicate SD (n=3) (left panel). PC-3 cells were transfected with the indicated siRNAs and expression plasmids in the presence or absence of TBB before application to the upper chamber. Error bars indicate SD (n=3) (right panel). (D) PC-3 cells were transfected with the indicated siRNAs or treated with TBB. Invasive growth was analyzed by counting cells that migrated through the extracellular matrix layer of Biocoat Matrigel invasion chambers. Error bars indicate SD (n=3) (left panel). The level of IP-10 mRNA was determined by real-time PCR. Error bars indicate SD (n=3). (right panel).

