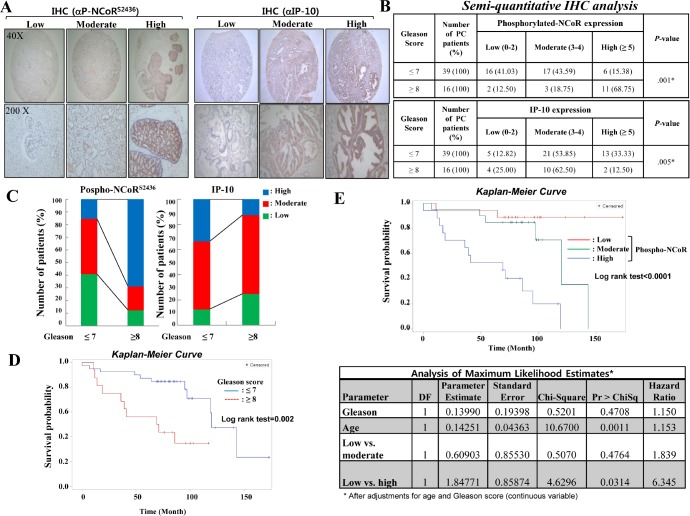
Figure 5. Inverse relationship between IP-10 and NCoR phosphorylation during prostate cancer development.
(A) Immunohistochemical staining of tissue sections was performed using phospho-NCoR and IP-10 antibodies at a 1:100 dilution. (B) Immunohistochemical staining of tissue sections was scored semi-quantitatively. The semi-quantitative analysis of immunohistochemical staining was calculated by: expression score = percentage of staining (0-3) + intensity score (0–3) among 55 patients with prostate cancer tissue. (C) Inverse relationship of phospho-NCoR with IP-10 expression between high-Gleason score (≥8) prostate cancer patients. (D) The survival rate of high-Gleason score (≥8) prostate cancer patients was significantly lower than that of low-Gleason score (≤7) prostate cancer patients according to Kaplan–Meier survival curve analyses. (E) Kaplan–Meier curves (upper panel) and Cox proportional hazard model analyses (lower panel) estimate the survival rate according to the phospho-NCoR level in the cohort. The Cox proportional hazard model analysis was performed after adjustments for age and Gleason score (continuous variable).

