
Figure 3.
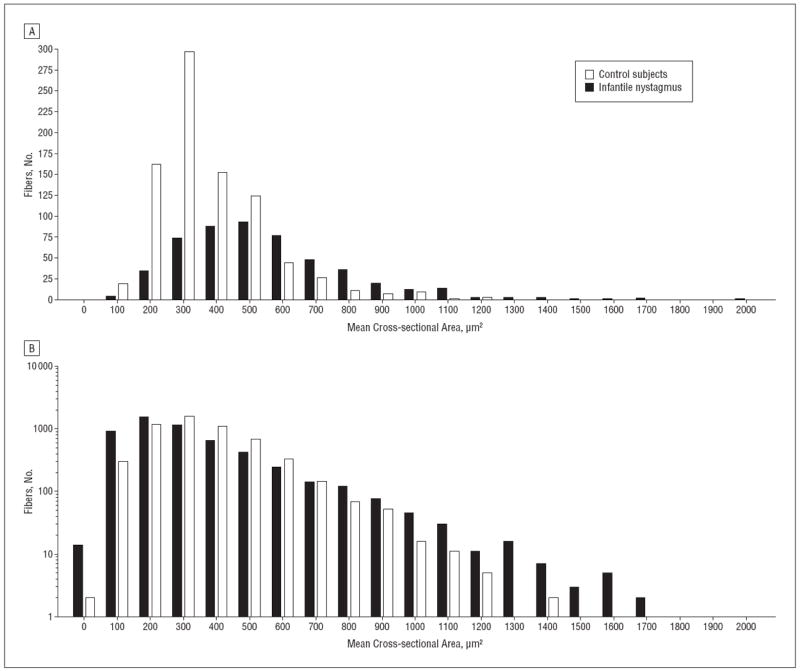
Histograms of myofiber size demonstrating increased heterogeneity of myofiber cross-sectional areas in muscles from patients with infantile nystagmus. A, Histogram of myofiber cross-sectional areas from medial rectus muscles from 1 control (case 2) and 1 patient with infantile nystagmus (patient 5). The y-axis is in log10. B, Histogram of aggregated myofiber cross-sectional areas from extraocular muscles from controls and patients with infantile nystagmus. The y-axis is in log10.