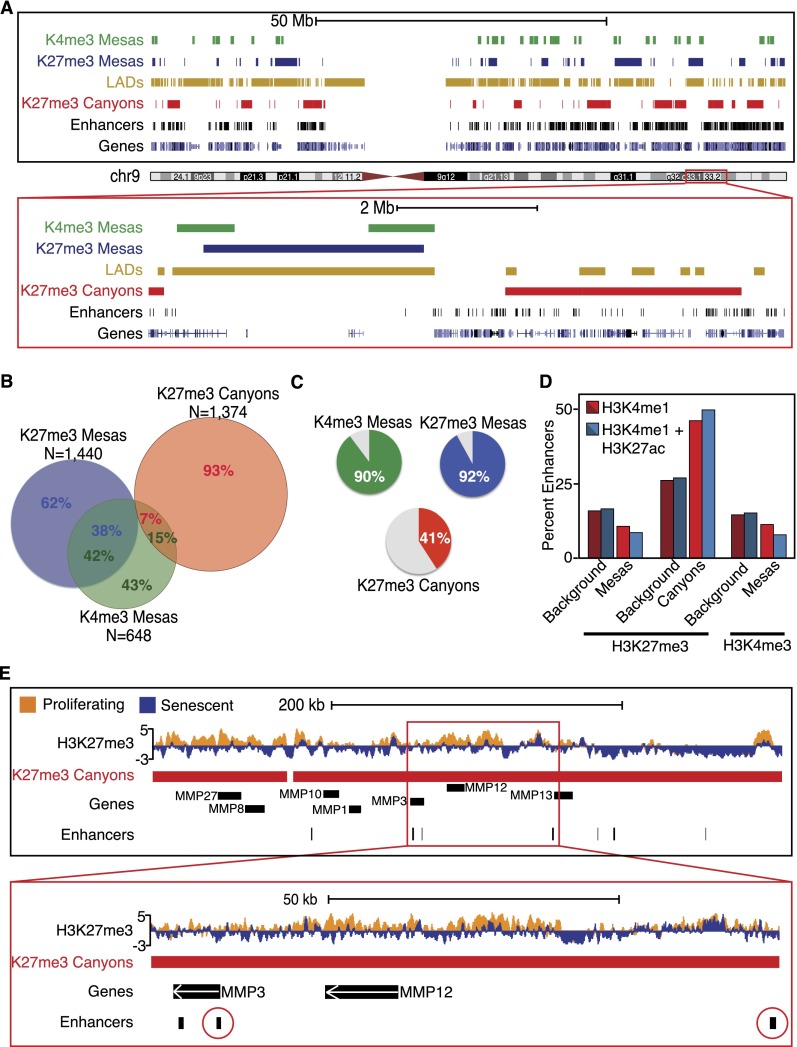
Figure 2.
Mesas are overlapped features that are enriched for LADs; canyons are outside of LADs and enriched for enhancers. (A, top) Representation of all K4me3 (green blocks) and K27me3 (blue blocks) mesas and K27me3 canyons (red blocks) across the whole of chromosome 9. LADs are shown in gold blocks, enhancers are shown in black blocks, and genes are shown in blue blocks at the bottom of the image. Whole-chromosome views show the enrichment for mesas within LADs and canyon formation adjacent to LADs or in general LAD-poor regions. Moreover, canyons appear to be enriched for enhancers, which are also located outside of LADs and in gene-rich regions. (Bottom) Closer view of a section of a 9.2-Mb region of chromosome 9 (Chr9: 118,000,000–127,200,000) highlights the relationship of mesas with LADs and canyons with enhancer regions. (B) Venn diagram representation of the nucleotide overlap between K4me3 mesas, K27me3 mesas, and K27me3 canyons shows a high degree of overlap between the two mesas but little overlap between canyons and mesas, highlighting the difference between the large-scale changes that are visually depicted in A. (C) Pie chart representations of the percent of nucleotides in K4me3 mesas (top left panel in green), K27me3 mesas (top right panel in blue), and K27me3 canyons (bottom panel in red) that overlap with LADs. Most nucleotides in mesas overlap with LADs (90% for K4me3 mesas and 92% for K27me3 mesas), but only 41% of canyon nucleotides overlap with LADs, highlighting the difference between the large-scale changes that are visually depicted in A. (D) Column plot representation of the overlap between K4me3 mesas, K27me3 mesas, and K27me3 canyons with two categories of enhancers (H3K4me1 shown in red and H3K4me1+H3K27ac shown in blue) highlights the enrichment of enhancers in K27me3 canyons over background measure. Mesas, as expected, are not enriched for enhancers. (E) Example track view of the MMP cluster on chromosome 11 that shows H3K27me3 loss over genes and enhancers. The bottom view is a closeup of the MMP3 and MMP12 genes (up-regulated in senescence; Chr11: 102,017,147–102,489,087) with a cluster of enhancers (circled in red) nearby that are also contained within the K27me3 canyon.

