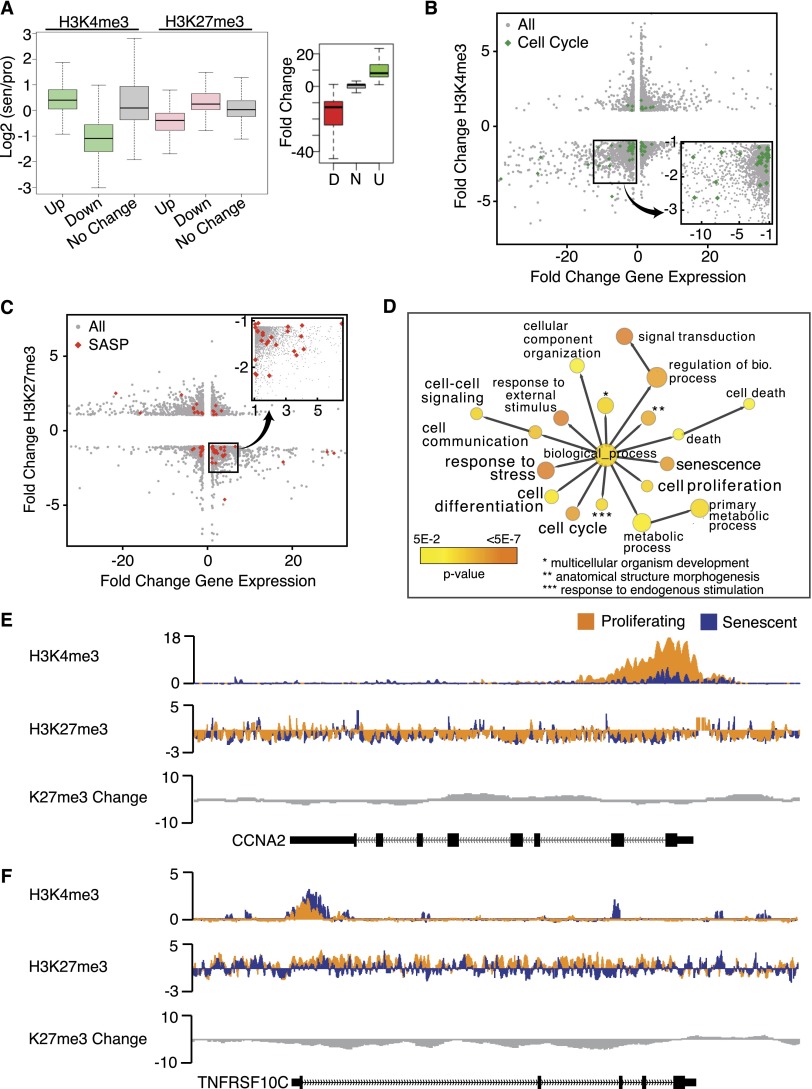
Figure 4.
Changes in H3K4me3 and H3K27me3 are correlated to gene expression changes in senescence. (A) Box plot representation of H3K4me3 (green) and H3K27me3 (pink) at the top 500 up-regulated and down-regulated genes in senescence shows loss of H3K4me3 at down-regulated genes and loss of H3K27me3 at up-regulated genes. Control genes (no change) are shown in gray boxes. Box plot on the right depicts the range of expression changes at the top 500 up-regulated and down-regulated genes. Enrichment is reported as a ratio of senescence/proliferating, and all ChIP-seq signal is normalized to total histone H3. (B) Scatter plot analysis of H3K4me3-mediated gene regulation in senescence; fold change H3K4me3 is shown on the Y-axis, and fold change gene expression is shown on the X-axis. Cell cycle genes are marked in green. The bottom left quadrant contains down-regulated genes that also lose H3K4me3. The boxed region in the bottom left quadrant is shown in the closeup on the right to highlight the enrichment of cell cycle genes for H3K4me3 loss. (C) Scatter plot analysis of H3K27me3-mediated gene regulation in senescence; the fold change H3K27me3 is shown on the Y-axis, and the fold change gene expression is shown on the X-axis. SASP genes are marked in red. The bottom right quadrant contains up-regulated genes that also lose H3K27me3. The boxed region in the bottom right quadrant is shown in the closeup on top to highlight the enrichment of SASP genes for H3K27me3 loss. (D) GO analysis of up-regulated genes that lose H3K27me3 shows a strong enrichment for genes that are involved in the senescence pathway, including senescence genes, anti-proliferation genes, and cell death/stress genes. Each GO category color indicates the level of significance (yellow to orange, as shown on the key in the bottom left). (E) Sample tracks of H3K4me3 and H3K27me3 ChIP-seq data over a down-regulated cell cycle gene, CCNA2 (Chr4: 122,955,000–122,966,500), show pronounced loss of H3K4me3 at the promoter and TSS of the gene. Proliferating tracks are shown in orange, senescence tracks are shown in blue, and H3K27me3 change is shown in gray. The gene location is shown on the bottom track. (F) Sample tracks of H3K4me3 and H3K27me3 ChIP-seq data over the up-regulated SASP gene TNFRSF10c (Chr8: 23,012,616–23,034,551) show pronounced loss of H3K27me3 across the gene. Proliferating tracks are shown in orange, senescence tracks are shown in blue, and H3K27me3 change is shown in gray. The gene location is shown on the bottom track.

