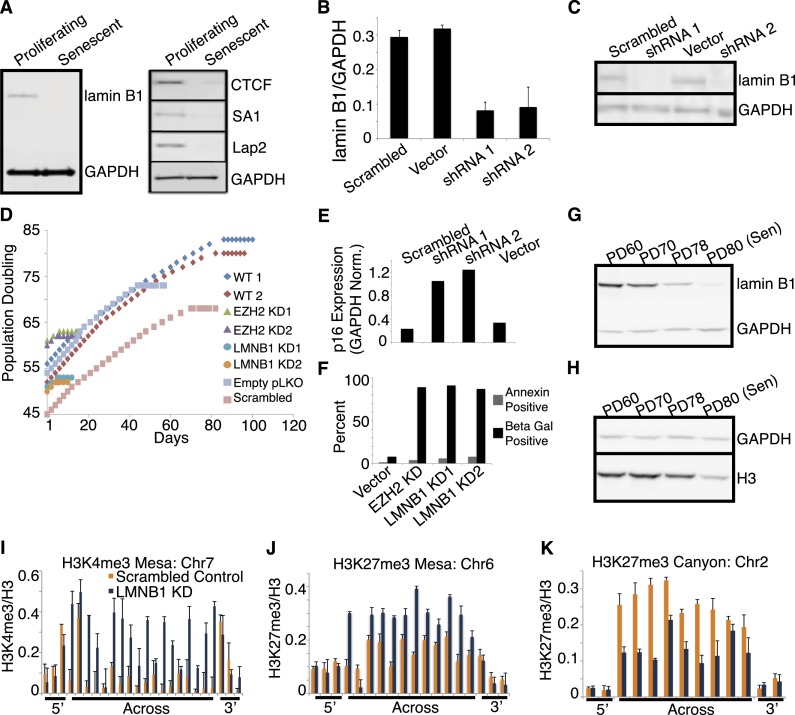
Figure 5.
Lamin B1 is significantly decreased in senescence, and LMNB1 knockdown in proliferating cells causes formation of canyons and mesas. (A, left panel) Western blot analysis of total lamin B1 in proliferating and senescent cells shows lamin B1 loss in senescent cells. Lysates were normalized by total cell count; GAPDH was used as a loading control. (Right panel) CTCF (boundary element), SA1 (cohesin component), and Lap2 are decreased in senescent lysates compared with proliferating cells. Lysates were normalized by total cell count with GAPDH as a loading control. (B) qRT–PCR measure of lamin B1 mRNA expression in knockdown compared with control. LMNB1 expression is reduced by >60% by two different shRNA constructs (shRNA 1 and shRNA 2) compared with scrambled hairpin and vector-only control infected cells. (C) Western blot analysis of total protein in LMNB1 knockdown compared with control. Total lamin B1 is significantly reduced at the protein level in two knockdowns (shRNA1 and shRNA 2) compared with scrambled hairpin and vector-only control infected cells. Lysates were normalized by total cell count with GAPDH used as a loading control. (D) Life span analysis of LMNB1 knockdown shows rapid senescence within two PDs following cell infection compared with controls. Life span is visualized by plotting PDs (Y-axis) to days of growth in culture (X-axis). Two life spans of wild-type (WT), uninfected IMR90 show senescence after 78 (red diamonds) and 81 (blue diamonds) PDs. EZH2 knockdown causes senescence after only two cell passages following infection (green and purple triangles). LMNB1 knockdown by two different shRNA constructs shows the same kinetics of rapid senescence as EZH2 (turquoise and orange circles). The rapid senescence kinetics are specific to EZH2 and LMNB1 knockdown, as empty vector-only and scrambled hairpin infections (blue and pink squares) have a nearly normal life span, although not as long as wild-type controls (red and blue diamonds). The flattening of the growth curves indicates the length of time that cells were kept in a senescent state prior to harvesting for further experimentation. (E) LMNB1 knockdown results in up-regulation of p16. qRT–PCR measure of p16 expression in LMNB1 knockdown cells compared with control shows expected senescence up-regulation of p16 following LMNB1 knockdown. Relative p16 expression is up-regulated in two knockdowns (shRNA1 and shRNA 2) compared with scrambled hairpin and vector-only control infected cells; GAPDH was used as a control. (F) LMNB1 and EZH2 knockdown causes cellular senescence, not cell death. EZH2 and LMNB1 knockdown does not cause significant cell death, as measured by annexin staining compared with empty vector control. EZH2 and LMNB1 knockdown cells undergo rapid senescence, within two PDs, as measured by SA-β-gal staining, compared with empty vector control. For both types of knockdown, stably infected cells were maintained in culture for 2–3 d to ensure growth cessation prior to experimentation. (G,H) Western blot analysis of lamin B1 expression (G) and histone H3 expression (H) in a time course of IMR90 cells approaching senescence. The PD60, PD70, and PD78 time points are all proliferating states compared with senescence at PD80. Lamin B1 levels appear to be decreasing in proliferating cells prior to achievement of senescence compared with GAPDH control (G), whereas histone H3 decrease does not appear to occur until cells are in a senescent state compared with GAPDH control (H). (I–K) ChIP-qPCR evidence for K4me3 mesa (Chr7: 61,558,937–64,197,991), K27me3 mesa (Chr6: 167,743,380–169,126,883), and K27me3 canyon (Chr2: 85,956,542–86,782,134) formation in LMNB1 knockdown (KD; regions defined in replicative senescence). Control knockdown data are shown in orange, and LMNB1 knockdown is shown in blue. ChIP-qPCR primers are tiled across the entire region of the mesas and canyon and include 3′ and 5′ flanking primers. ChIP-qPCR data are shown as ratios of modification to total histone H3. ChIP-qPCR data are the average of three biological replicates, and error bars represent standard deviation from the mean.

