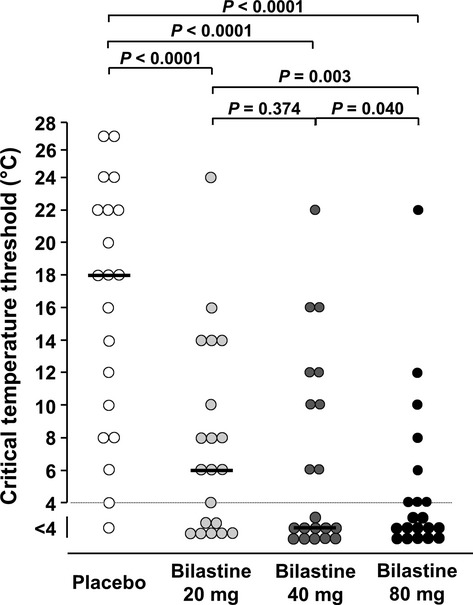
Figure 2.

Critical temperature thresholds for the production of wheals following cold provocation. The horizontal lines indicate medians. The levels of significance values are for differences in the median critical temperature thresholds calculated using Wilcoxon's nonparametric test.
