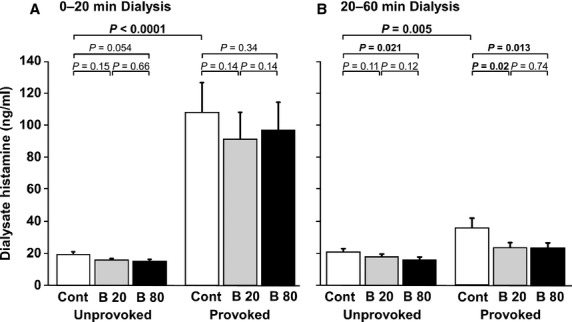
Figure 4.

Dialysate levels of histamine. The white columns (Cont) are the samples obtained at visit 2 when no drug had been given. The grey and red-black columns (B20 and B80) are the samples obtained after administration of 20 and 80 mg of bilastine daily for 7 days. Each result is the mean ± SEM of results in 20 patients. The statistical differences were calculated using Student's t-test for paired data.
