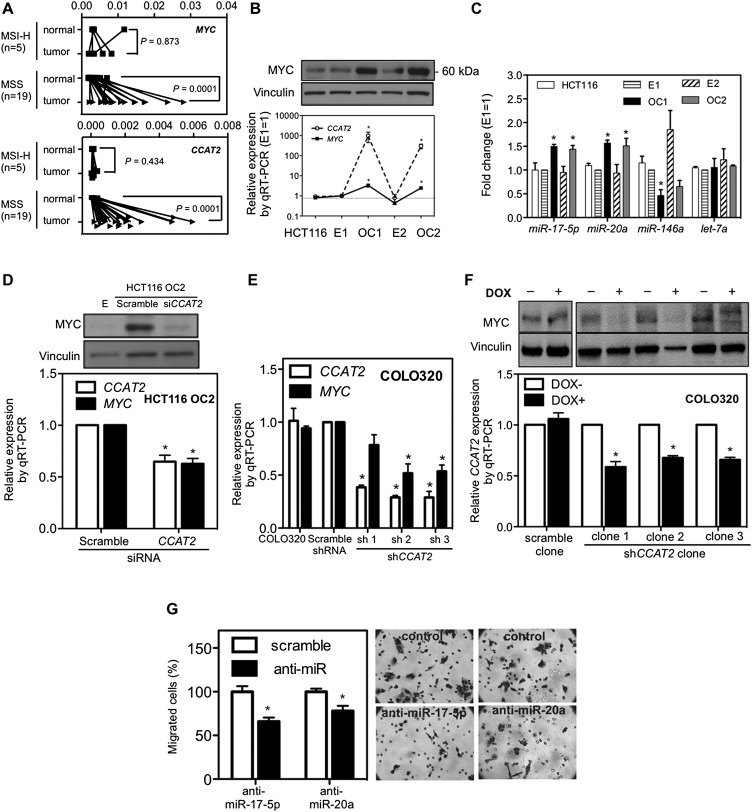
Figure 4.
Regulation of MYC expression by CCAT2. (A) Increased CCAT2 and MYC expression in MSS CRC samples. Expression profile of MYC and CCAT2 in paired CRC/control mucosa samples from Italy using qRT-PCR. (B) Correlation of MYC protein and CCAT2 RNA levels in HCT116 clones with high and basal CCAT2 levels. (C) CCAT2 increased miRNA expression of the MIR17HG, decreased miR-146a expression, and exerted no consistent effect on let-7a (used as negative control). (D) Down-regulation of MYC (upper panel: protein; lower panel: RNA) by CCAT2 siRNA in HCT116 OC2 clone. (E) Reduced MYC expression in COLO320 shCCAT2 stable clones. (F) Reduction of MYC in doxycycline-inducible shCCAT2 clones of COLO320. (G) Reduction of migration in CCAT2-transduced HCT116 cells by anti-miR-17-5p and anti-miR-20a. Twenty-four hours after anti-miR treatment, cells were seeded onto a migration assay chamber for another 24 h, and migrated cells were stained and counted. (*) P < 0.05.

