Table 2.
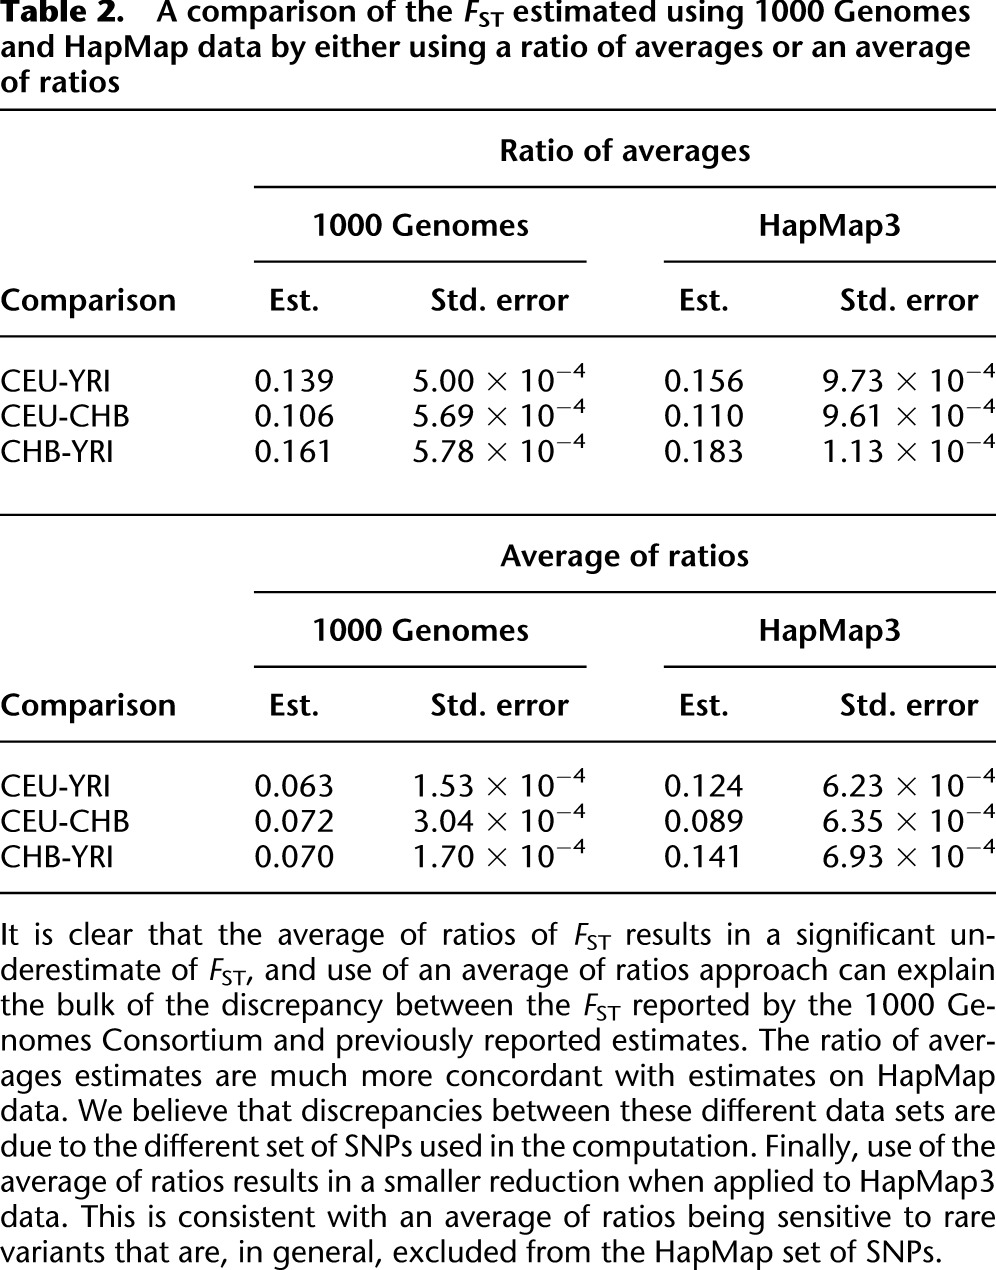
A comparison of the FST estimated using 1000 Genomes and HapMap data by either using a ratio of averages or an average of ratios

A comparison of the FST estimated using 1000 Genomes and HapMap data by either using a ratio of averages or an average of ratios
