Figure 1.
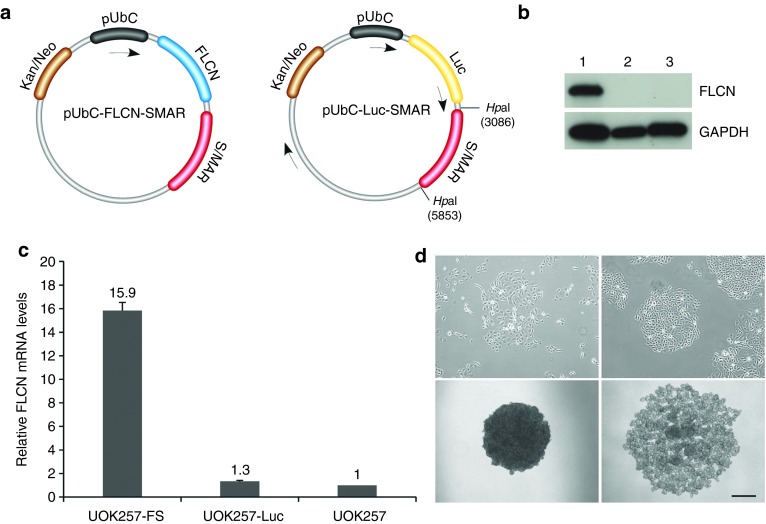
Characterization of UOK257-FS cells. (a) Schematic representation of plasmids pUbC-FLCN-SMAR (left) and pUbC-Luc-SMAR (right) used for transfection. The S/MAR module is located downstream of the expression cassette. Digestion sites used for restriction analysis of plasmid rescue are shown. The arrows depict the positions of PCR primers used for sequencing. (b) Western analysis of FLCN expression in stable FLCN-restored UOK257-FS cells (1), UOK257-Luc cells (2) and UOK257 cells (3). (c) FLCN mRNA levels as measured by quantitative RT-PCR. Columns indicate mean values ± SEM (n = 3). (d) Morphology of UOK257-FS (left panel) and UOK257 cells (right panel) on adherent plates (top panel) and in 3D culture (bottom panel). Magnification 4x. Scale bar = 500 μm.

