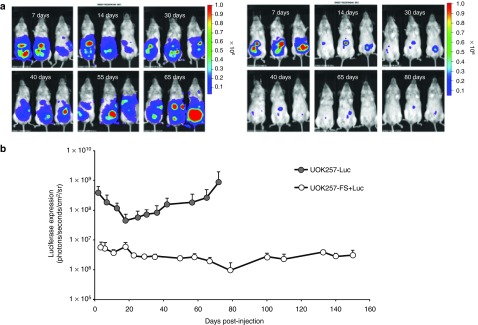
Figure 5.

Longitudinal analysis of luciferase in UOK257-FSLuc and UOK257-Luc xenografts. Two groups of mice (n = 5) were innoculated intraperitoneally with 3 × 10⁶ cells of either UOK257-FSLuc or UOK257-Luc. (a) Representative photos from three animals from each group showing the level of luciferase expression are shown over time. The intensity of luciferase is represented from high to low as red to blue, as indicated by the colored bar. (b) Luciferase expression is shown up to day 72 for both groups (n = 5) and up to day 150 for animals treated with UOK257-FSLuc. Columns represent mean ± SEM (n = 3).
