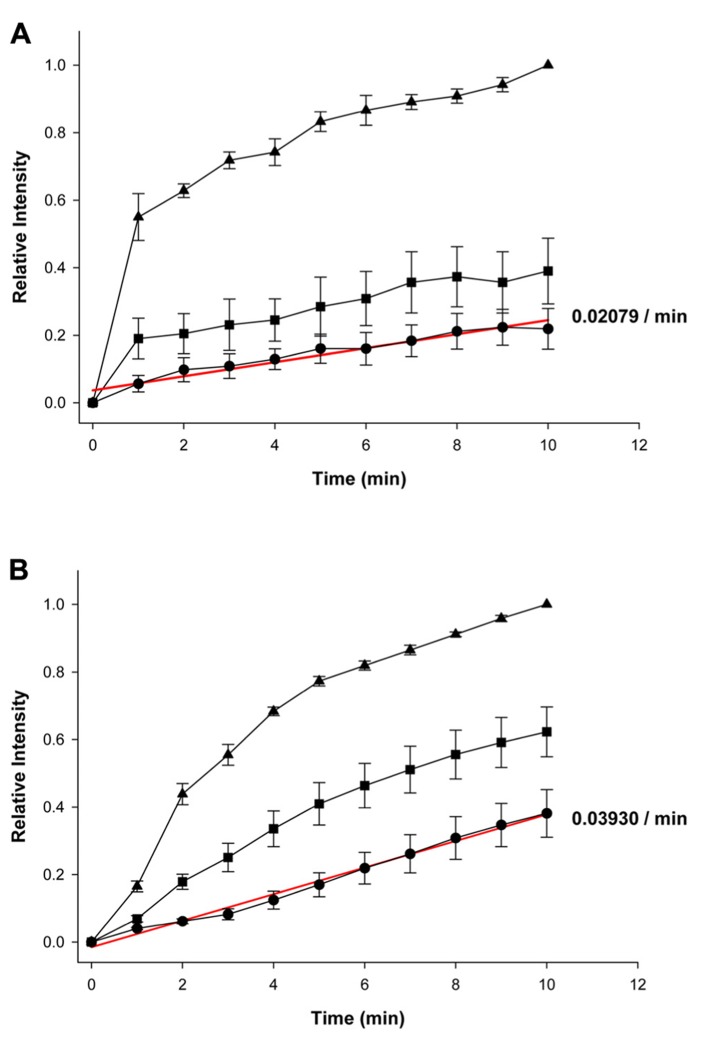
FIGURE 2.
Summary plots of fluorescence intensity versus time. (A) Summary of averaged and normalized control (n = 6 experiments) and (B) 5 mM 4-PB data (n = 4 experiments). First (source) cell (▲), second cell (■), and third cell (•). Error bars are representative of SE. Solid red lines correspond to the first-order regressions with r2 = 0.94 and r2 = 0.99 for control and 4-PB treated cells, respectively.

