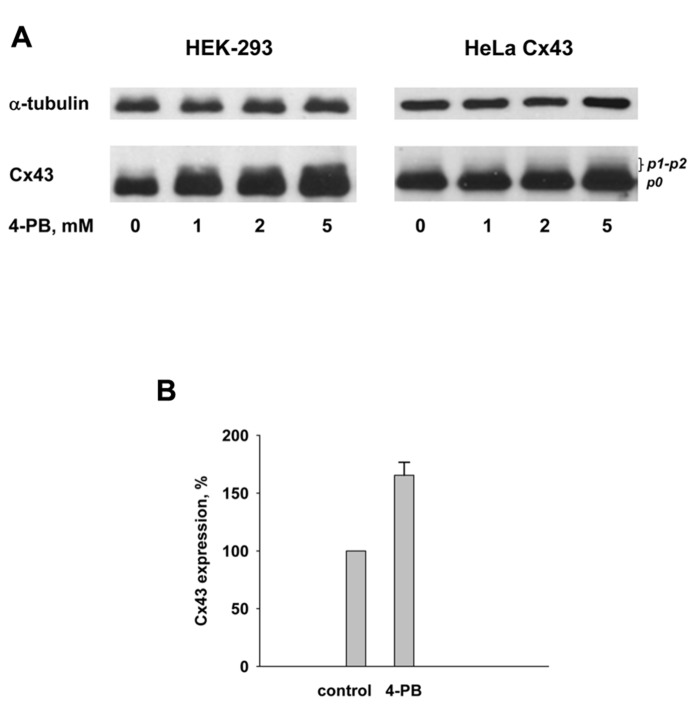
FIGURE 5.
(A) Western blot analysis of HEK-293 (left panel) and HeLa Cx43 (right panel) cells using polyclonal Cx43 antibody. Lines from left to right correspond to 0, 1, 2, and 5 mM 4-PB, respectively. Anti-α tubulin is shown as a reference indicator. (B) Summary of Western blot data from four experiments with HEK-293 control cells and cells exposed to 5 mM 4-PB. Upon exposure to 5 mM 4-PB Cx43 expression increased to 166 ± 11% which was statistically significant (p = 0.029) in comparison to the control cells (0 mM 4-PB) where Cx43 expression was assumed to be 100%.

