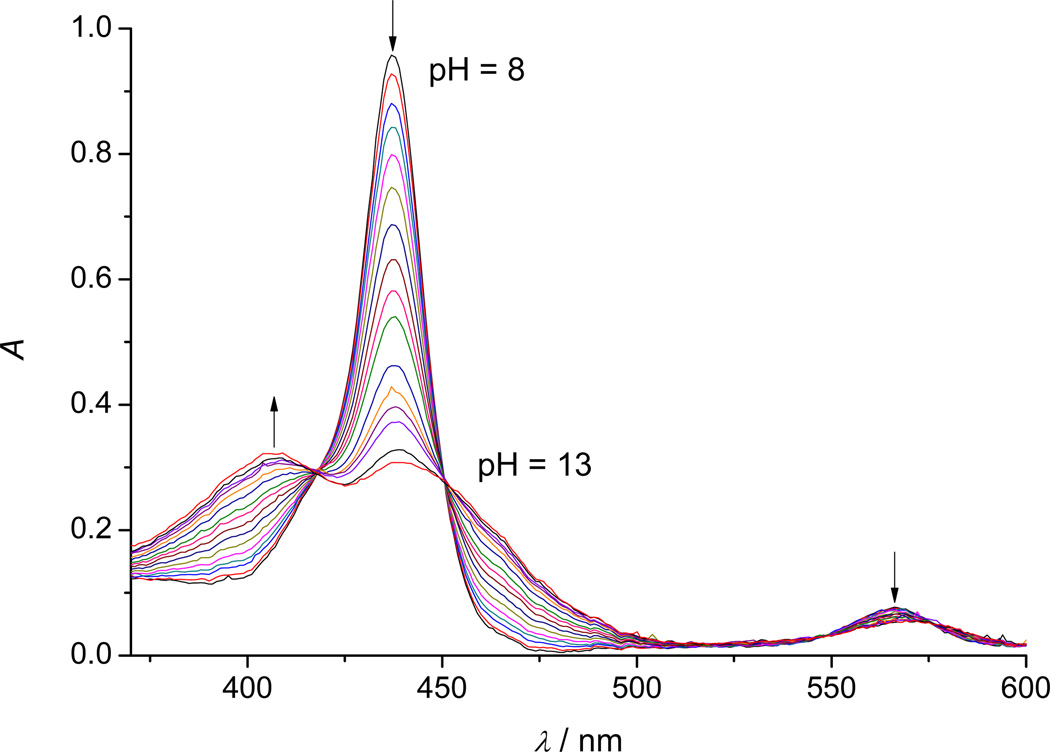
Figure 3.
A typical titration profile of 5 µM MnIITE-2-PyP in 2 M NaClO4 with 0.2 M NaOH, (θ= 25 °C, l = 1 cm). The pH values of the solution were varied within the pH-range 8–13 (for the sake of clarity not all measured spectra are shown). Spectra obtained at pH < 8 are shown in Figure 5.

