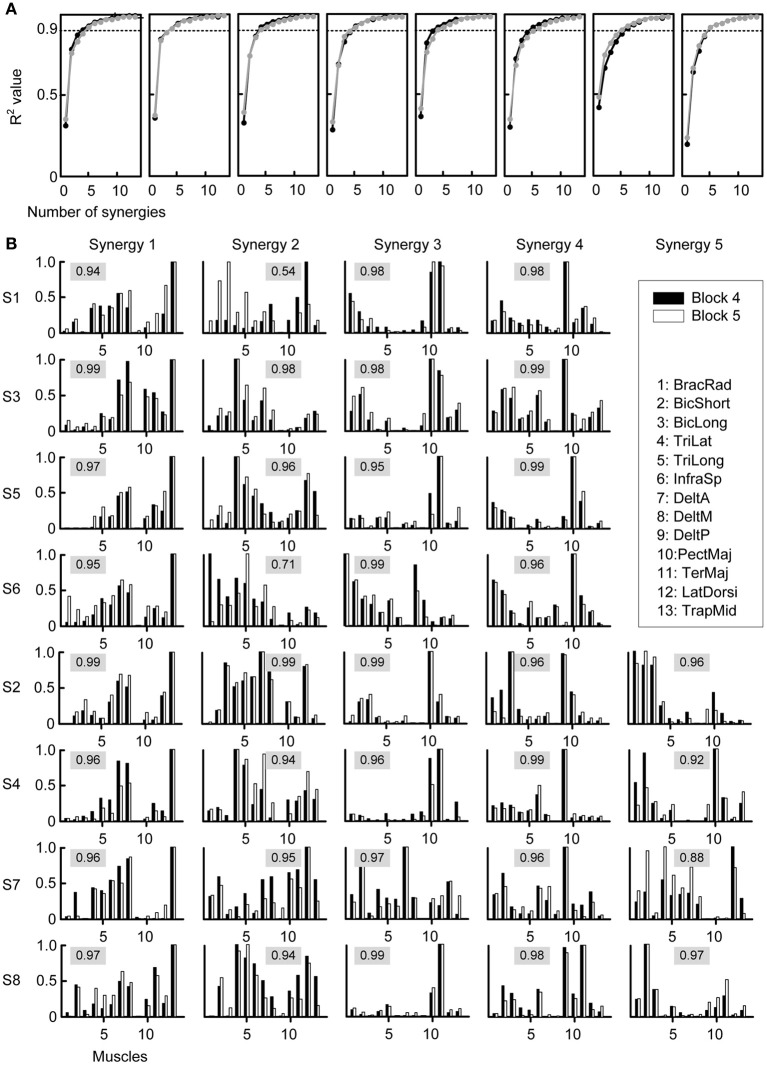
Figure 4.
Selection of number of synergies and synergy structure. (A) Fraction of total variation explained (R2) by the synergies extracted from Block 4 (last baseline block, black) and by the synergies extracted from Block 5 (first perturbation block, gray) were similar for all subjects (different plots). (B) Synergies from all subjects (rows) extracted from Block 4 (black bars) and Block 5 (gray bars). The numeric value in each plot represents the similarity between the two synergies, quantified by the scalar product of the normalized synergies (cosine-value).

