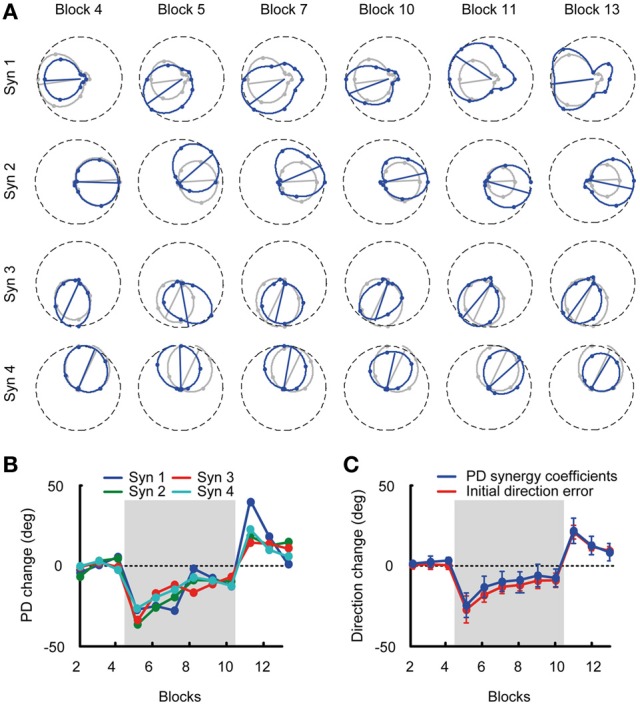
Figure 6.

Tuning curves and preferred directions of synergy coefficients. (A) Example of tuning curves for the four synergies of subject 3 estimated from different blocks (blue markers and lines) compared to the tuning curves calculated from the pooled data of all baseline blocks (reference blocks, gray markers and lines). (B) Mean PD-change of synergy coefficients for subject 3 for all blocks. (C) Grand mean of the PD-change across synergies and subjects (blue) and initial direction angle error (red) for all blocks. The PD change of the synergy coefficients was not statistically different from the initial direction angle error.
