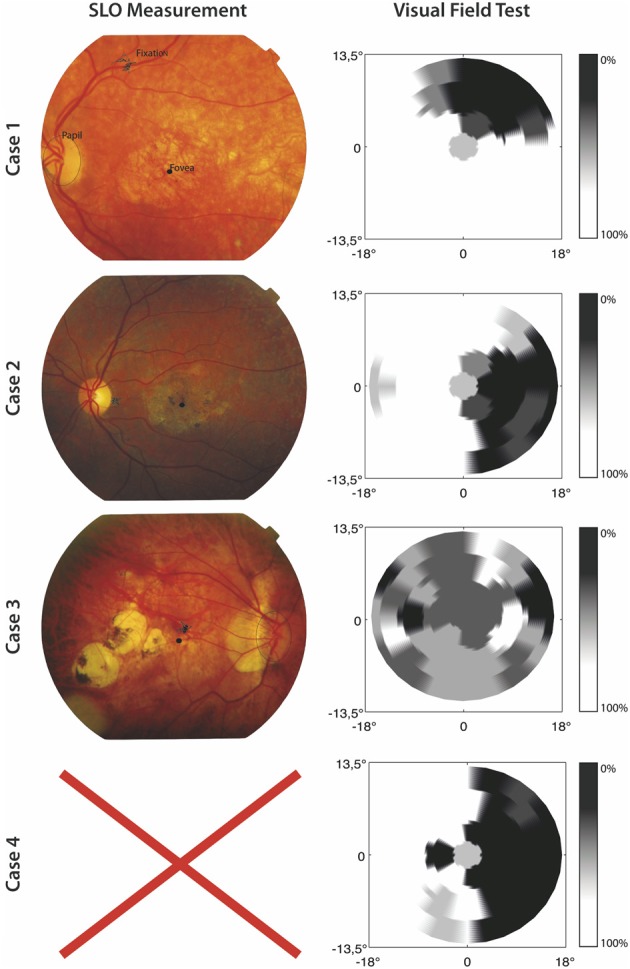
Figure 1.

SLO Measurement and results of the visual field test for the included MD patients. The left panel shows SLO pictures where fixation, fovea, and papilla are marked. No SLO measurement was possible for Case 4. For the results of the visual field test the gray scale indicates the percentage correctly identified targets.
