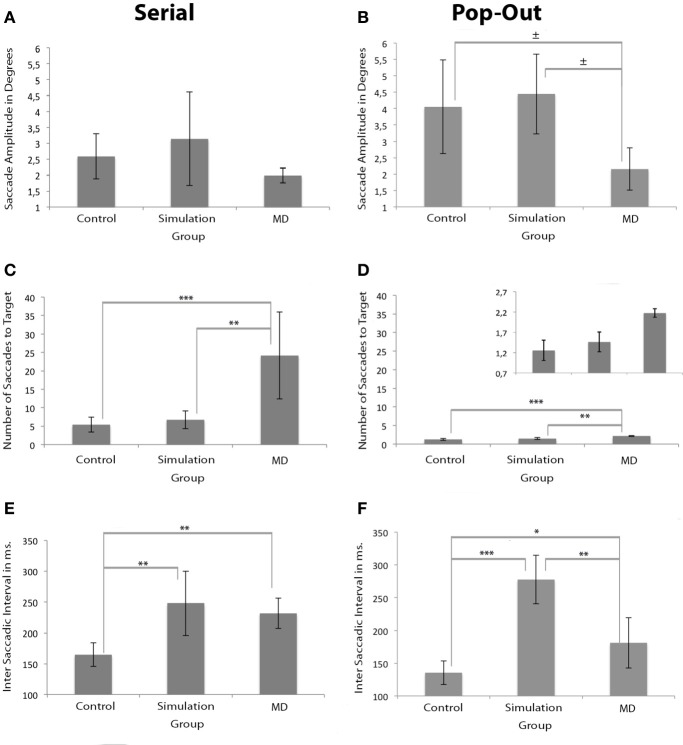
Figure 4.
Measurements of oculomotor characteristics. Left and right panels show the results for the serial and pop-out conditions. (A,B) Show saccade amplitudes. (C,D) Show the number of saccades before the eye landed on the target for both conditions. The figure of the number of saccades for the pop-out condition is presented twice: once with the same range as the serial condition and once with an adapted range for visibility of the differences between the groups. (E,F) Show the inter-saccade-interval in milliseconds for both conditions. Significant differences are indicated (*p < 0.05, **p < 0.01, and ***p < 0.001; ± 0.05 > p <0.07).

