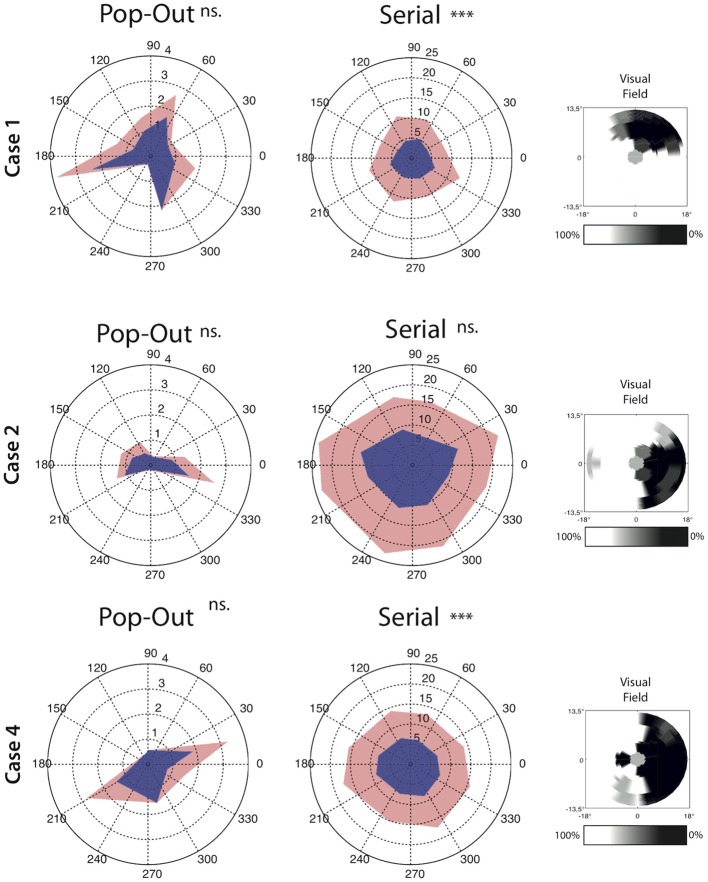
Figure 5.
Average angle by direction characteristics for all saccades for each condition separately. Saccade amplitude is depicted as the radius whereas the angle represent the direction of the saccades. Upper confidence interval is plotted in light-red on top of the average saccade amplitude. Note that the left and middle panel have a different range. The right panel for each case depict the interpolated scotoma based on measurements from the visual field test. Cases 1 and 4 show lower saccade amplitude toward the scotoma than away from the scotoma in the serial search condition. Significant differences are indicated (***p < 0.001, ns. = non-significant).

