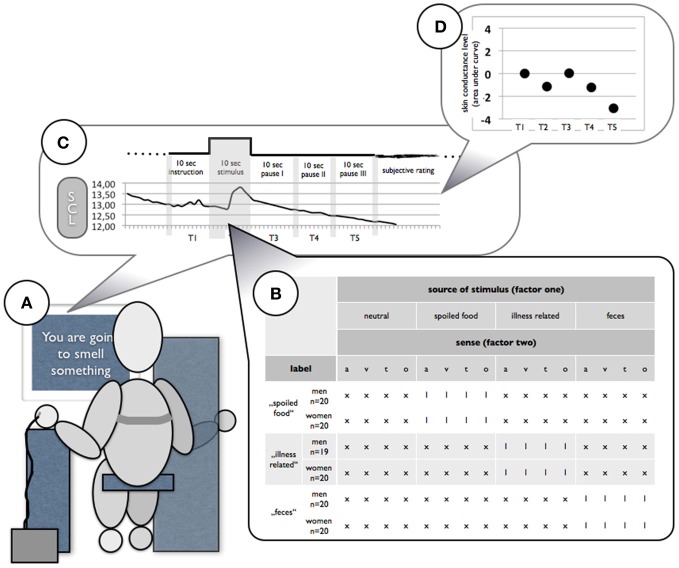
Figure 1.
Schematic visualization of the experimental setup. (A) Participants sat in front of a monitor where instructions and pictures were presented. Auditory stimuli were presented via head set, olfactory were presented in opaque brown glass jars which were placed under the participant's nose and tactile stimuli were placed in the participant's supine hand without the participant seeing them. (B) Each participant received 16 different stimuli; one of the disgust categories was presented labeled for each participant. (C) During the whole experiment HR, SCL, and SBP were recorded. (D) After recording AUC was calculated to baseline for four 10-s intervals during and after stimulus presentation.

