
Figure 3.
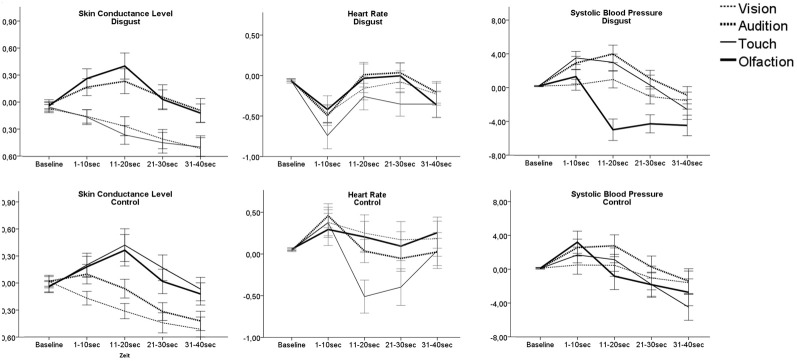
Autonomic responses as AuC following presentation of disgusting and control stimuli. Lines show mean response of the participants toward the three disgusting stimuli applied through each sense. Note: Only participants' response for stimuli presented unlabeled are presented in order to avoid possible label influences. Error bars indicate 95% confidence interval.