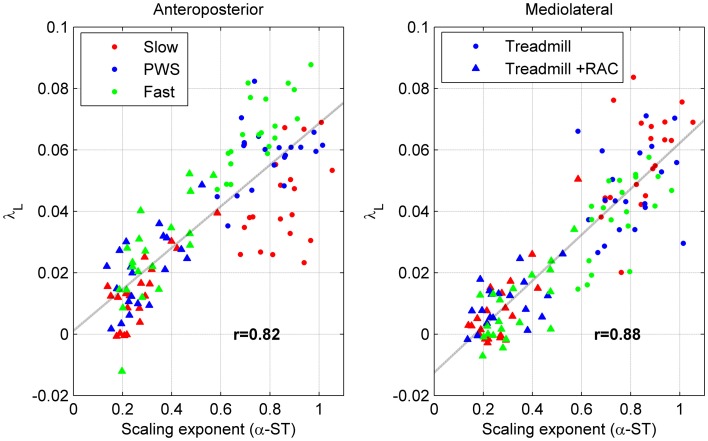
Figure 5.
Scatter plot of statistical persistence and long-term local dynamic stability (LDS). Twenty subjects walked on a treadmill at slow speed (red), preferred walking speed (PWS, blue), and fast speed (green) without (circles) and with (triangles) rhythmic auditory cueing (N = 120). Detrended fluctuation analysis was used to determine the scaling exponents of the time series of stride time (α-ST, see Appendix B), which are plotted along the horizontal axis. Divergence exponents (λL, see Figure 4) are plotted along the vertical axis. The discontinuous line is the best linear fit (least squares method). Values are the Pearson's correlation coefficients (r).

